Edge Styles
Edges are rendered using IEdgeStyle implementations. yFiles for HTML provides a selection of predefined edge styles:
- PolylineEdgeStyle
-
A polygonal edge style that uses straight line segments to connect the bends. This style supports arrows and bridges. It is discussed in more detail in section PolylineEdgeStyle.
- BezierEdgeStyle
-
Provides an edge represented as a cubic Bézier path. Bends are interpreted as control points. This style supports arrows. It is discussed in more detail in section BezierEdgeStyle.
- ArcEdgeStyle
-
Provides an arc representation for an edge. Bends are ignored. This style supports arrows. It is discussed in more detail in section ArcEdgeStyle.
- BridgeEdgeStyle
-
Provides a three-segment bridge representation for an edge. Bends are ignored. This style supports arrows and bridges. It is discussed in more detail in section BridgeEdgeStyle.
- ArrowEdgeStyle
-
Provides a single-segment arrow shape representation for an edge. Bends are ignored. It is discussed in more detail in section ArrowEdgeStyle.
PolylineEdgeStyle
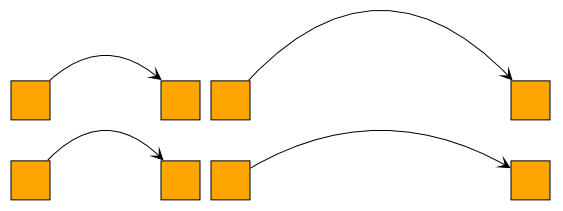
The PolylineEdgeStyle connects the ports and bends of an edge with straight line segments.
Like most edge styles, PolylineEdgeStyle allows you to set the edge’s color and line width. It also supports arrows, allowing you to set a sourceArrow and targetArrow. More details about arrows can be found below.
PolylineEdgeStyle also supports smoothed bends when you set a value greater than 0 for smoothingLength.

// default: black line, no arrows
const node1 = graph.createNodeAt([0, 0])
const node2 = graph.createNodeAt([300, 0])
const edge = graph.createEdge(node1, node2, new PolylineEdgeStyle())
graph.addBend(edge, [100, -40])
graph.addBend(edge, [200, 40])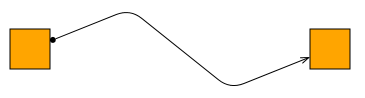
// default pen, source and target arrows, smoothing length 30
const node1 = graph.createNodeAt([0, 100])
const node2 = graph.createNodeAt([300, 100])
const edge = graph.createEdge(
  node1,
  node2,
  new PolylineEdgeStyle({
    sourceArrow: 'circle',
    targetArrow: 'simple',
    smoothingLength: 30
  })
)
graph.addBend(edge, [100, 60])
graph.addBend(edge, [200, 140])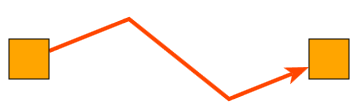
// thick red pen with matching arrow
const node1 = graph.createNodeAt([0, 200])
const node2 = graph.createNodeAt([300, 200])
const edge = graph.createEdge(
  node1,
  node2,
  new PolylineEdgeStyle({
    stroke: '4px solid orangered',
    targetArrow: new Arrow({
      fill: 'orangered',
      lengthScale: 2,
      widthScale: 2,
      type: 'stealth'
    })
  })
)
graph.addBend(edge, [100, 160])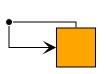
graph.addBend(edge, [200, 240])PolylineEdgeStyle handles self-loops, that is, edges which start and end at the same node. Self-loops without bends are rendered with an orthogonal path which exits and enters the node. For self-loops with one bend, the same applies, but the path is chosen so that the bend lies on one of the path’s corners. Self-loops with two or more bends are rendered normally.


BezierEdgeStyle
The BezierEdgeStyle draws an edge as a cubic Bézier path. The bends, together with the source and target port locations of the edge, serve as control points for this path.

const node1 = graph.createNodeAt([0, 0])
const node2 = graph.createNodeAt([300, 0])
const edge = graph.createEdge(
  node1,
  node2,
  new BezierEdgeStyle({ targetArrow: 'stealth' })
)
graph.addBend(edge, [100, -40])
graph.addBend(edge, [130, -20])
graph.addBend(edge, [150, 0])
graph.addBend(edge, [170, 20])
graph.addBend(edge, [200, 40])Like most edge styles, BezierEdgeStyle allows you to set the edge’s color and line width. It also supports arrows, which allows you to set a sourceArrow and targetArrow. More details about arrows can be found below.
BezierEdgeStyle does not handle self-loops on its own. Developers must add at least two bends if they want to visualize self-loop edges with this style.
This style disables interactive bend creation and orthogonal editing and does not add bridges to its path. The Bezier Edge Style demonstrates how to support interactive edge editing for BezierEdgeStyle.
ArcEdgeStyle
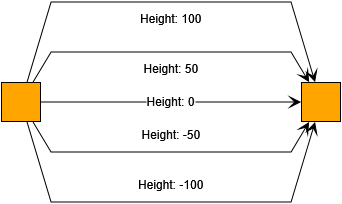
The ArcEdgeStyle renders an edge as an arc, with the height property determining the distance between the arc and the direct line connecting the edge’s source and target port locations. A positive height value places the arc to the left of the edge’s flow direction. The edge’s bends are not considered.
const node1 = graph.createNodeAt([0, 0])
const node2 = graph.createNodeAt([300, 0])
const edge = graph.createEdge(
  node1,
  node2,
  new ArcEdgeStyle({ height: 50, targetArrow: 'stealth' })
)Like most edge styles, ArcEdgeStyle allows you to set the edge’s color and line width. It also supports arrows, which lets you set a sourceArrow and a targetArrow. You can find more details about arrows can be found below.
The height can be specified either in absolute or relative coordinates, depending on the fixedHeight property. If fixedHeight is disabled, the height is interpreted as a factor to multiply the length of the line between the source and target ports.
ArcEdgeStyle cannot visualize self-loops.
By default, the ArcEdgeStyle provides a handle that supports interactive reshaping of the arc.
You can disable this by setting provideHeightHandle to false.
BridgeEdgeStyle
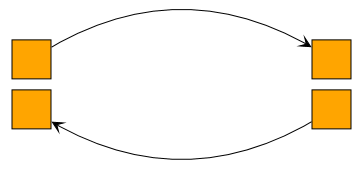
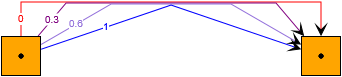
The BridgeEdgeStyle renders an edge as a 3-segment bridge, offsetting it from the direct line between the edge’s source and target port locations by a specified height. A positive height value offsets the bridge to the left of the edge’s flow. The bends of the edge are ignored.
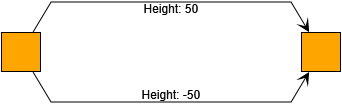
const node1 = graph.createNodeAt([0, 0])
const node2 = graph.createNodeAt([300, 0])
const edge1 = graph.createEdge(
  node1,
  node2,
  new BridgeEdgeStyle({ targetArrow: 'stealth', height: 50 })
)
const edge2 = graph.createEdge(
  node1,
  node2,
  new BridgeEdgeStyle({ targetArrow: 'stealth', height: -50 })
)Like most edge styles, BridgeEdgeStyle allows you to set the edge’s color and line width. It also supports arrows, which allows you to set a sourceArrow and targetArrow. You can find more details about arrows below.
The height property determines the height of the bridge above the baseline, using absolute coordinates.
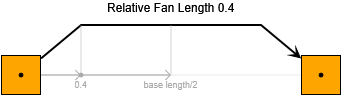
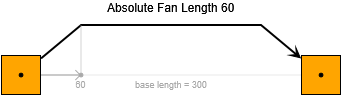
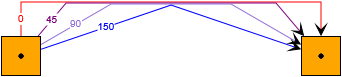
The fanLength property determines the length of the fan or slope segment relative to the baseline distance. Values from 0 to 1 indicate a length relative to half the distance between the source and target ports. For example, a value of 1 means that the fan covers the entire distance up to the midpoint. All other values are interpreted as absolute coordinates. Values that extend beyond half the distance between the source and target ports, or are less than 0, are capped to prevent visual artifacts.


BridgeEdgeStyle cannot visualize self-loops.
By default, the BridgeEdgeStyle provides a handle that supports interactive adjustment of the bridge height.
You can disable this feature by setting provideHeightHandle to false.
ArrowEdgeStyle
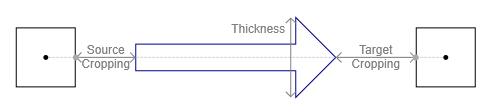
The ArrowEdgeStyle renders an edge as a single-segment bridge arrow shape with configurable arrow tip angle and arrow shaft thickness. The bends of the edge are ignored for this style.
Here is an example of how to create the style with code.
graph.createEdge(
  source,
  target,
  new ArrowEdgeStyle({
    shape: 'arrow',
    thickness: 10,
    sourceCropping: 5,
    targetCropping: 1,
    fill: 'white',
    stroke: 'dark-blue'
  })
)Arrow Shape
The basic shape is determined by the same properties as for the Arrow Shapes of ArrowNodeStyle.
Here is an example of how to create the notched shape with code.
graph.createEdge(
  source,
  target,
  new ArrowEdgeStyle({
    shape: 'notched-arrow',
    angle: Math.PI / 8,
    thickness: 10,
    shaftRatio: 1,
    sourceCropping: 10,
    targetCropping: 10,
    stroke: 'black',
    fill: null
  })
)Thickness and Cropping
In addition to those shape properties, ArrowEdgeStyle also provides further properties that determine how the shape is arranged along the edge segment:
- thickness
-
Defines the thickness of the arrow shape at its widest point.
- sourceCropping
- targetCropping
-
Defines the amount of space to crop from the imaginary line between the source and target node intersection point. This shortens the arrow and leaves room at the arrow’s end and tip, respectively.
Custom Styles
yFiles for HTML offers abstract style implementations, the EdgeStyleBase<TVisual> and the PathEdgeStyleBase. Creating custom styles using these classes as a base is discussed in detail in Customizing Styles.
Invisible Edges
The IEdgeStyle.VOID_EDGE_STYLE can render an edge invisible, even though the edge is still part of the graph structure. Additionally, the edge will not be subject to any interactions, such as mouse clicks.
graph.setStyle(invisibleEdge, IEdgeStyle.VOID_EDGE_STYLE)Decorations: Arrows
Arrows are visual decorations that can be placed at the ends of an edge. Typically, this decoration is an arrowhead, which indicates the edge’s direction.
|
Important
|
Arrows do not define the direction of an edge; they only indicate it. The distinction is that, in the graph model, an edge has a defined source and target end. Arrows can appear on either end, independent of the source or target definition. Also, some graph analysis and layout algorithms might assume an edge direction that aligns with the graph model but differs from the visualization. |
As visual decorations, they are used with IEdgeStyle implementations that support arrows. In yFiles for HTML, these are PolylineEdgeStyle, BezierEdgeStyle, ArcEdgeStyle, and BridgeEdgeStyle.
There are several predefined arrowhead rendering types which can be specified when creating an Arrow. You can use these arrows with the sourceArrow and targetArrow properties of these styles.
const edgeStyle = new PolylineEdgeStyle({
  sourceArrow: 'circle',
  targetArrow: 'diamond'
})| Type | Visualization |
|---|---|
|
|
|
|
|
|
|
|
|
|
|
|
|
|
|
|
|
|
|
An arrow’s size and color are independent of the edge. If you use an edge stroke other than the default, you most likely also need a non-default arrow configuration.
const edge = graph.createEdge(
  node1,
  node2,
  new PolylineEdgeStyle({
    stroke: '8px solid red',
    targetArrow: new Arrow({
      fill: 'red',
      lengthScale: 4,
      widthScale: 4,
      type: 'stealth'
    })
  })
)The distance between the node-edge intersection and the tip of the arrow (the anchor point) is called the crop length. You can set this value as a constructor parameter and access it using the property cropLength property. Set a non-zero crop length if a custom port visualization extends outside the node bounds or if you want to display a gap between the arrow and the node.
Developers can implement the IArrow interface to create custom arrow visualizations. This is described in detail in Customizing Arrows.
Decorations: Bridges
When there are many crossing edges, especially when they are orthogonal, it can be difficult to determine where an edge actually leads. Bridges, or line jumps, are a way to resolve the visual ambiguity caused by intersecting edge paths. Each segment of an edge path that intersects with at least one other segment (from either the same or another edge path) can be augmented with a bridge in one of a variety of different styles, such as gap, arc, and rectangle.

Bridge rendering is handled by the BridgeManager class. It can be enabled on a GraphComponent’s graph by setting the GraphComponent to BridgeManager’s canvasComponent property:
const bridgeManager = new BridgeManager()
bridgeManager.canvasComponent = graphComponent
bridgeManager.addObstacleProvider(new GraphObstacleProvider())To determine “obstacles” to render a bridge around, the BridgeManager instance uses an implementation of the IObstacleProvider interface. The interface’s single method is used to get a GeneralPath that defines an obstacle.
The GraphObstacleProvider class, which is used in the above example code, is a convenience implementation that by default incorporates the obstacle definitions returned by all edges from the current graph in the BridgeManager’s GraphComponent.
|
Note
|
By default, you can find an appropriate IObstacleProvider implementation in the lookup of each edge that uses a PolylineEdgeStyle, ArcEdgeStyle, BezierEdgeStyle, or BridgeEdgeStyle. |