The Component for Displaying Graphs
yFiles for HTML provides a powerful tool for graph visualization: the class GraphComponent. This component is one of yFiles for HTML’s most prominent features and is specifically designed to combine the various parts of yFiles for HTML to visualize and interact with graphs.
The GraphComponent centralizes all of yFiles for HTML’s functionality and is our recommended way to display yFiles for HTML graphs. This component displays and connects the graph model with the interaction functionality, and is highly flexible and customizable in doing so.
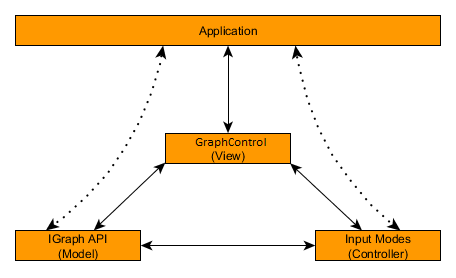
The GraphComponent also serves as an entry point to the complete yFiles for HTML functionality. Using the GraphComponent, you have access to all other parts of the library, such as the graph model, the user interaction, graph I/O, layout, and many more. It is also directly responsible for managing the view and displaying the elements, as well as propagating events.
In particular, its core features are:
-
Propagating the native HTML events to the proper parties in the library or dealing with them itself.
-
Managing the visual representation of the elements displayed in it, for example, graph elements and decorations like selection, focus, and highlighting.
-
Presenting a view on the underlying graph model that supports scrolling, zooming, panning, and other navigational core features needed for an explorational application.
The following chapters give a brief introduction to some of the core features and how to work with them.
Managing the View
The view refers to what the user can see. Users might look at an entire graph or zoom in to focus on smaller sections. To present the user with the information they want as they zoom and pan around the graph, you will need to manage the view.
It consists of two parts:
-
The viewport is the rectangle that defines the part of the graph that is currently visible. The point in the graph that is visible in the upper left corner of the viewport is called the view point.
-
The content bounds are the union of the bounds of all graph items.
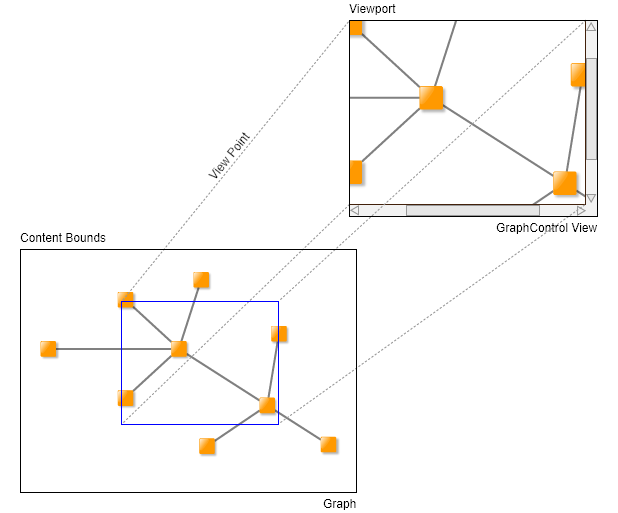
At this point, it is crucial to understand that there are two different coordinate systems needed to achieve this displaying system. One is the coordinate system in which the graph and its elements are defined, and the other is the coordinate system native to the component itself. The former is called the world coordinate system, while the latter is called the view coordinate system.
|
Note
|
There are methods on GraphComponent and other types that conveniently convert from one coordinate system to the other. These methods are most useful when you want to implement your own visualization. Most issues that arise when defining custom visualizations are caused by using the wrong coordinate system. |
The Visible Area: the Viewport
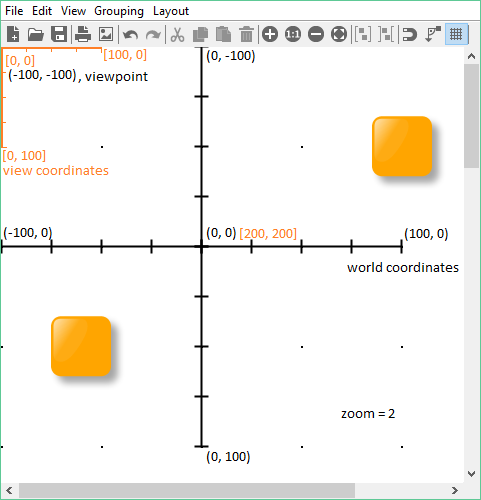
Both systems are logically connected through the view point. It is the point in world coordinates that is the upper left corner of the viewport rectangle, the area that the GraphComponent displays. In this regard, the upper left corner of the viewport is also regarded as the origin (0, 0) of the view coordinate system.
The viewport’s width and height are determined by the GraphComponent’s physical size scaled by the value of its zoom property. The area in world coordinates that is shown in the viewport is the rectangle that has its upper left corner at the view point and the bounds of the GraphComponent’s physical size scaled by the zoom property. So, for example, if the view point is at the origin in world coordinates, the GraphComponent’s physical size is (100, 100), and the zoom value is 0.5, then the depicted area of the world coordinates in the GraphComponent is a rectangle with its upper left corner at (0, 0) and a width and height of 50 units. This means that the viewport is zoomed in on the particular area.
To change the visible area of the graph programmatically, there are a number of options:
- viewPoint: Point
- zoom: number
-
Those two properties represent the low-level approach to changing where the viewport is, and while they work well, there are more convenient options that are discussed below. Also, since setting the zoom property keeps the center of the viewport the same, the zoom level must be set first before setting the view point.
- zoomTo(bounds: Rect): void
- zoomTo(zoom: number, center: Point): void
- zoomToAnimated(bounds: Rect): Promise<void>
- zoomToAnimated(zoom: number, center: Point): Promise<void>
-
These methods change the zoom factor and viewport either immediately or in an animated fashion.
- fitContent(animated: boolean): Promise<void>
- fitGraphBounds(margins: Insets, animated: boolean): Promise<void>
-
Those methods ensure that the current content bounds (or the graph) fit neatly into the viewport.
- ensureVisible(bounds: Rect, viewportPadding: Insets, mode: ViewportLimitingMode): Promise<void>
- ensureVisible(points: IEnumerable<Point>, viewportPadding: Insets, mode: ViewportLimitingMode): Promise<void>
-
Those methods move the viewport towards an area that must be visible and can be used to ensure that the current point of interaction is visible.
There are also various commands that can change the viewport, some of which offer additional control over command parameters.
Moving the viewport interactively or zooming using the mouse wheel is automatically supported by the GraphComponent and its input modes (see also the chapter User Interaction).
Many interactive viewport changes, or those triggered by commands, are animated to provide the user a smooth transition from the old viewport to the new one. This includes the following interactions:
-
Zooming or scrolling with the mouse wheel
-
Zoom commands, such as ZOOM, INCREASE_ZOOM, ZOOM_TO_CURRENT_ITEM, or ZOOM_TO_SELECTION
-
Scroll commands, such as SCROLL_PAGE_LEFT, etc.
-
The fitContent and ensureVisible methods and corresponding commands
-
The ensureVisible methods, which are used when graph items may need to be made visible because they are outside the viewport
Those animations can be turned off for individual groups of interactions with the animatedViewportChanges property. The getViewportAnimationDuration method can be used to customize the animation duration or whether to animate for each individual case.
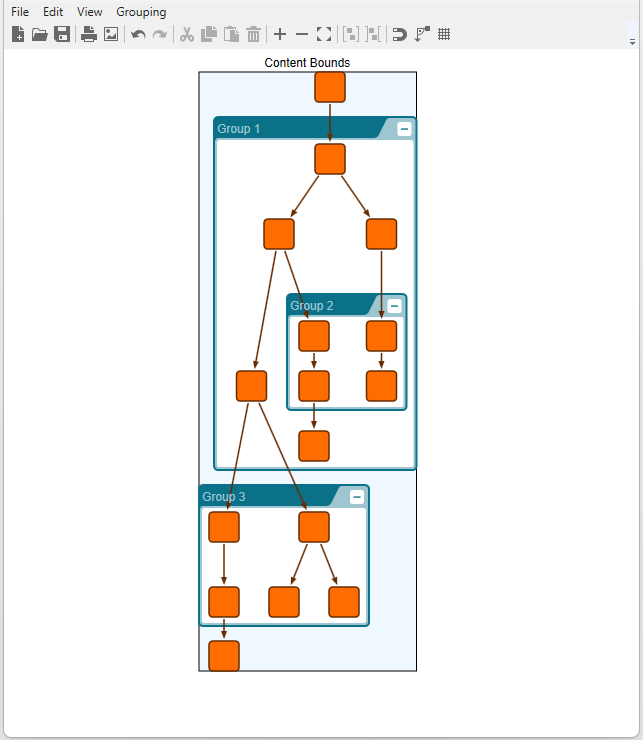
The Content Bounds
The content bounds on the other hand are a rectangular area in the world coordinate system that encompasses all elements in the graph model. It is not updated automatically. The reason for this is that there are too many atomic changes that would cause unnecessary triggers. Rather, it is updated on interactive changes to the graph structure that will most probably expand the rectangle (like node creation) or when the application programmer calls the update method updateContentBounds. Therefore, the content bounds are guaranteed to always encompass all graph elements, but not that they are always the smallest possible rectangle to do so.
The content bounds define merely the logical bounds of the graph and do not limit the viewport in any way. Rather, they can be used to comfortably acquire the graph bounds. For example, the fitContent method will automatically adjust the view point and zoom property of the GraphComponent in such a way that the viewport fully contains the content bounds in an optimal way.
The part of the world bounds to which you can zoom or scroll is theoretically unlimited. This means that a user can zoom and scroll to any location in the world coordinate system. Per default, the view port is limited to at least show a little bit of the content bounds. The ways to restrict the visible area are discussed in the section Restricting the Viewport.