Graphs and Diagrams
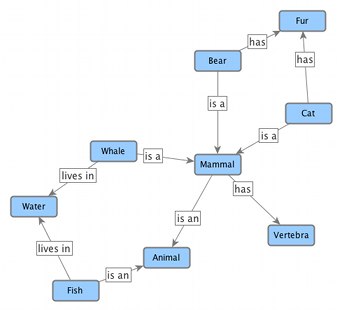
In yFiles for HTML, a graph is defined as a set of objects where some pairs of objects may be connected. We call such an object a node (instead of entity, vertex, or element) and a connection an edge (instead of link, relation, or arc). Edges can be directed or undirected.


A diagram is a visualization of the data represented by a graph. However, we often do not distinguish between the two terms if the meaning is clear from the context.
|
Important
|
The ambiguity of the terms graph and visualization can cause misunderstandings of the purposes of yFiles for HTML. Specifically, the yFiles for HTML library does not provide any functionality to draw pie charts, function plots, or anything similar. |
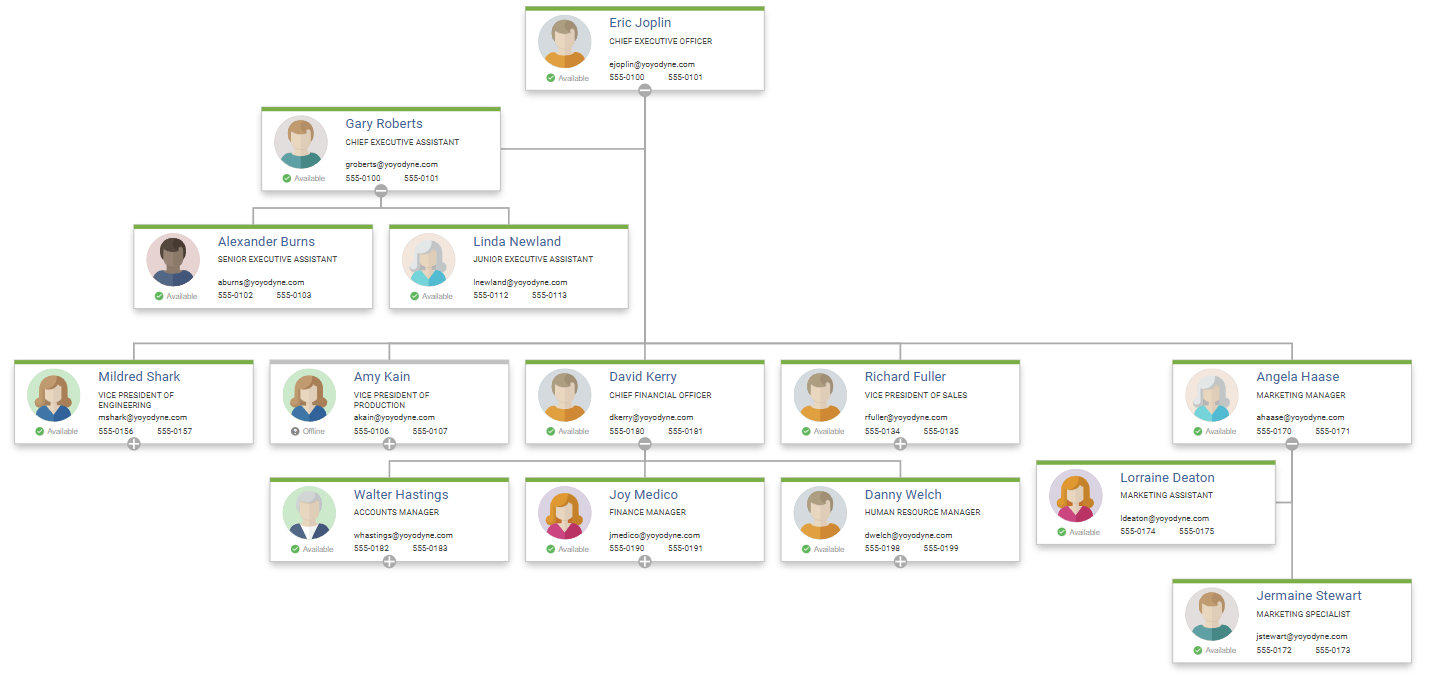
Diagrams naturally arise in a wide variety of application domains. Often, a node is represented by a visualization such as a shape, icon, or image. An edge is usually represented by a connecting line between its two nodes, with or without some decoration at its ends. Captions or labels often provide extra textual information.
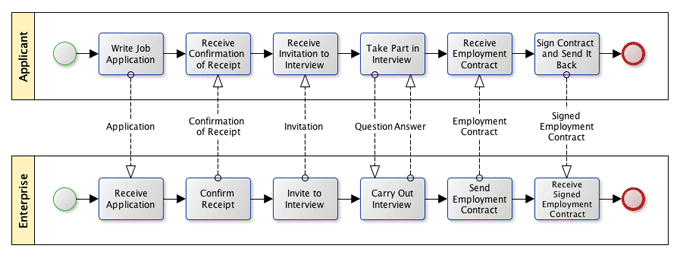
The benefits of diagrams can be summarized with the proverb, “a diagram is worth a thousand words:”
-
Complex topics can be arranged to provide a clear picture of hidden structures and dependencies.
-
Tangled relationships can be clarified quickly.
-
Information can be easily communicated to a broad audience.
However, these properties strongly depend on the quality of a diagram. The task of making legible diagrams is often tedious and error-prone when done by hand. Sketching even small data sets can become awkward and is often avoided.
With large data sets, it becomes even more difficult to create high-quality, easy-to-understand diagrams. Doing it by hand is no longer an option, increasing the need for automatic generation.