WebGL2 Rendering
Sometimes it is necessary to visualize large graphs in their entirety to get an overview of the data. In these cases, the focus is often on the connections and clusters of elements rather than the details of single nodes and edges.
Therefore, yFiles for HTML offers a rendering mechanism that uses WebGL to provide hardware-accelerated graph rendering and interaction. WebGL is integrated into all modern browsers and allows for calculating all graphics operations directly on the GPU (graphics processing unit). Hence, the rendering works in parallel with the CPU operations, which makes applications faster and more responsive.
Clicking on graph elements for selection is supported by fast WebGL hit-testing. This enables the usual interactions like moving or deleting elements, adding bends, resizing nodes, or editing labels.
Although all layout algorithms of yFiles for HTML work in combination with WebGL rendering, some handle large graphs better than others. Consider using HierarchicalLayout, OrganicLayout, TreeLayout, and RadialTreeLayout depending on the desired layout style.
|
Note
|
yFiles for HTML supports both WebGL and WebGL2 rendering. However, these technologies are implemented differently and therefore cannot be used in combination. It is highly recommended to use WebGL2 rendering unless compatibility issues or other reasons demand the use of WebGL. Therefore, going forward, when using the term WebGL, we refer to WebGL2. |
The decision between using WebGL rendering or SVG rendering depends on various factors, including the specific use case and the size of the graph being displayed. Consider the details of your project and the performance requirements before choosing a rendering method.
| WebGL Rendering | SVG Rendering |
|---|---|
Fast rendering of more than 20,000 elements |
Pixel-perfect visualization of nodes and edges |
Predefined, configurable styles for nodes, edges, and labels |
Flexible and highly customizable visualizations of nodes, edges, labels, and ports |
Predefined and easy-to-apply animations like blinking or pulsing of graph elements |
Customizable animations added in CSS and JavaScript |
From the comparison above, it follows that SVG rendering is the better choice for detailed representations or applications that require precise user interaction. WebGL rendering is more suitable for larger graphs (from 1,000 nodes upwards, often only for substantially larger graphs), when performance is more important than detailed representations.
Compared to SVG rendering, the most prominent limitations of WebGL rendering include:
-
Only the predefined styles are available. Custom styles cannot be defined and ports are not visualized at all.
-
Some interactions appear to be rough. For example, when a node is resized, the positions of its labels and decorations are updated only at the end of the gesture.
-
Snapping is not supported.
-
Changing the z-order of the graph elements is partially supported.
Enabling WebGL Rendering
To use WebGL rendering in your application, you need to set the WebGLGraphModelManager on the GraphComponent. This provides support for rendering graphs with WebGL.
For interactive applications that support selection, moving, resizing, and deleting graph elements, the WebGLSelectionIndicatorManager provides high-performance selection rendering that integrates with WebGL rendering.
graphComponent.graphModelManager = new WebGLGraphModelManager()
graphComponent.selectionIndicatorManager =
new WebGLSelectionIndicatorManager()The WebGL Rendering tutorial demonstrates how to enable WebGL rendering for a graph.
WebGL Styles
The WebGL rendering engine comes with a predefined set of styles for nodes, edges, and labels. The WebGLGraphModelManager infers the WebGL styles from the styles set on the graph. Since the WebGL styles can only render a subset of the regular styles, this matching may not be exact. Hence, it is possible to assign custom WebGL styles to graph elements directly on the IGraph.
|
Note
|
Conversely, you can set WebGL-specific styles even in SVG rendering mode. The styles displayed are then automatically inferred. However, since there is not an exact one-to-one match in style functionality between SVG and WebGL, some features of WebGL styles do not work in styles converted for SVG rendering. For example, the automatic conversion from WebGLImageNodeStyle to ImageNodeStyle. WebGLImageNodeStyle supports properties like image color or effect, which ImageNodeStyle does not. |
Node Styles
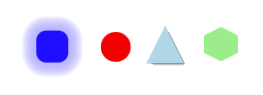
There are predefined shapes available for visualizing nodes. You can also customize the colors for the background and border. Additionally, you can easily apply effects such as drop shadows or ambient shine to nodes.
// set the node style directly on the graph
graph.setStyle(
  node,
  new ShapeNodeStyle({
    shape: 'ellipse',
    fill: 'green',
    stroke: '1px black'
  })
)

// set the WebGL-specific shape node style on the graph
graph.setStyle(
  node,
  new WebGLShapeNodeStyle({
    shape: 'ellipse',
    fill: 'green',
    stroke: 'black'
  })
)Optionally, nodes can display a centered icon. This icon must be pre-rendered and must be set directly on the WebGLGraphModelManager. It cannot be inferred from the ImageNodeStyle. The number of displayable icons depends on the graphic card’s memory size.
// canvas used to pre-render the icons
const canvas = document.createElement('canvas')
canvas.setAttribute('width', '128')
canvas.setAttribute('height', '128')
const ctx = canvas.getContext('2d')!

const image = new Image(imageWidth, imageHeight)
image.onload = () => {
  // render the image into the canvas
  ctx.drawImage(image, 0, 0, imageWidth, imageHeight, 0, 0, 128, 128)
  const imageData = ctx.getImageData(0, 0, 128, 128)
  const nodeStyle = new WebGLImageNodeStyle({
    image: imageData
  })
  const node = graph.createNodeAt(location)
  // assign the WebGL node style
  graph.setStyle(node, nodeStyle)
}
image.src = urlThe WebGL Image Node demo presents nodes with different font awesome icons.
Edge Styles
There are three ways to visualize edges: as a polyline, an arc, or a bridge. Edges can have different arrows on the source, target, or both sides. You can also customize the color of the line.
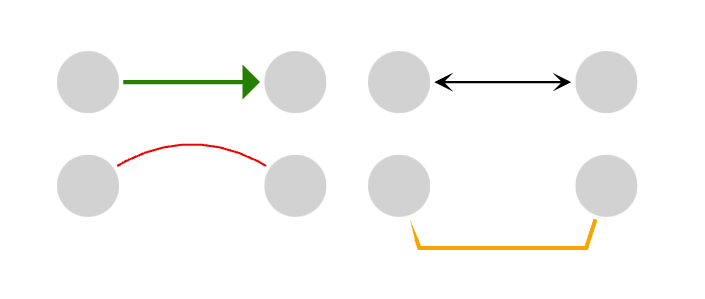
Edges whose source and target node are the same are either displayed as circles or rectangles.
// set the polyline edge style directly on the graph
graph.setStyle(
  polylineEdge,
  new PolylineEdgeStyle({
    stroke: '2px green',
    targetArrow: 'triangle'
  })
)

// set the WebGL-specific polyline edge style on the graph
graph.setStyle(
  polylineEdge,
  new WebGLPolylineEdgeStyle({
    stroke: '2px green',
    targetArrow: 'triangle'
  })
)

// set the arc edge style directly on the graph
graph.setStyle(
  arcEdge,
  new ArcEdgeStyle({
    height: 10,
    stroke: '2px green',
    targetArrow: 'triangle'
  })
)

// set the WebGL-specific arc edge style on the graph
graph.setStyle(
  arcEdge,
  new WebGLArcEdgeStyle({
    height: 10,
    stroke: '2px green',
    targetArrow: 'triangle'
  })
)Label Styles
Both nodes and edges can have labels. Those labels can have custom colors for text and background, different fonts, and custom insets. It is recommended to set a LabelStyle on the graph and let the WebGLGraphModelManager infer the WebGLLabelStyle for the labels automatically. That ensures that they have the correct size.
// set the label style directly on the graph
graph.setStyle(
  label,
  new LabelStyle({
    textFill: 'black',
    backgroundFill: '#FFFFFFBB',
    font: '16px sans-serif',
    textSize: 16
  })
)

// when setting WebGL node style for a node, make sure to also set a WebGL
// DefaultLabelStyle with the same settings to get the label's size correctly
graph.setStyle(
  label,
  new WebGLLabelStyle({
    textColor: 'black',
    backgroundColor: '#FFFFFFBB',
    font: '16px sans-serif'
  })
)As usual, the label layout parameter specifies the position of the labels. The WebGL rendering supports all locations for edge and node labels. However, the interactive behavior for edge labels always resembles the one of the FreeLabelModel. The memory of the graphics card and the sizes of the label texts determine the number of labels that can be rendered.
Directing Attention with Animations
The WebGL API offers several predefined animations that can be applied to nodes, edges, and labels. These animations can help to direct the user’s attention to specific elements or parts of a graph. For example, some animations affect the size of a node or label, or the thickness of an edge, creating effects like pulsation. Other animations change the location of a graph element to produce a vibration effect. Still other animations change the color of a graph element or make it fade in or out.
WebGLGraphModelManager provides factory methods to create these animations. They can be specified for nodes, edges, and labels.
// create a fade-out animation
const fadeAnimation = webGLGraphModelManager.createFadeAnimation(
  WebGLFadeAnimationType.FADE_OUT
)
// create a pulse animation that pulsates twice by the amount of 5
const pulseAnimation = webGLGraphModelManager.createPulseAnimation(
  WebGLPulseAnimationType.GROW,
  10,
  false,
  '1s 10'
)
// create a shake animation that shakes ten times by the amount of 2
const shakeAnimation = webGLGraphModelManager.createShakeAnimation({
  type: 'horizontal',
  magnitude: 2,
  // CSS-like shorthand for timing - auto-converted to WebGLAnimationTiming
  // 500ms duration, eased, 20 iterations, alternating animation
  timing: '500ms ease 20 alternate'
})

// apply animation to a node
webGLGraphModelManager.setAnimations(node, [fadeAnimation])

// apply animation to an edge
webGLGraphModelManager.setAnimations(edge, [pulseAnimation])

// apply animation to a label
webGLGraphModelManager.setAnimations(label, [shakeAnimation])

// apply multiple animations to a node
webGLGraphModelManager.setAnimations(node, [
  fadeAnimation,
  shakeAnimation,
  pulseAnimation
])

// clear all animations for a node
webGLGraphModelManager.setAnimations(node, [])Because it is possible to assign multiple animations to a single element, the animations are specified in an array.
|
Note
|
Animations should be shared and unassigned when they are not in use. The maximum number of assigned animations is limited to 15 per type of element. There can be only 8 animations assigned to one element at the same time, and only 31 different combinations of animations may be assigned to the items. To clear all animations for a given element, provide an empty animation array. |
Level of Detail Rendering
To achieve fast, hardware-accelerated rendering for a view of the complete graph and detailed, pixel-perfect rendering for a closer view of the graph elements, you can switch between the two rendering modes depending on the zoom level.
For a smooth and unnoticeable transition, choose styles like ShapeNodeStyle and ImageNodeStyle for both the detailed and the general view of the nodes. These styles have matching WebGL node styles. Alternatively, the detailed view can show a different, more detailed view of a node that highlights its attached information.
To allow for more fine-grained control over which style is displayed in which rendering mode, yFiles for HTML provides decorator classes where a style for each rendering mode can be set explicitly. These decorators are:
The Large Graphs demo showcases the level of detail switch from WebGL to SVG rendering and vice versa.
WebGL Support
All modern browsers, such as Chrome, Edge, Opera, Firefox, and Safari (on macOS >=12 and iOS >=15), support WebGL2. yFiles has been tested with recent versions of Chrome, Edge, Firefox, and Safari. In Safari on older macOS and iOS versions, WebGL2 is available as an experimental feature that must be enabled in the developer menu under Experimental Features.
Because WebGL relies on hardware acceleration, its performance depends more on the client’s system than browser-native rendering techniques like SVG or canvas rendering. WebGL rendering generally works best on desktop systems and most mobile devices, although mobile devices are more prone to rendering artifacts.
WebGL Limitations
-
WebGL styles do not match the SVG styles exactly, so switching between both rendering modes can lead to different visualizations even with the automated conversion of styles.
-
Some styles like WebGLImageNodeStyle and ImageNodeStyle cannot be automatically converted due to technical reasons.
-
The first/last segments of edges connecting to port locations outside the source and target nodes are only rendered correctly if those ports are located near the incident nodes. Otherwise, they may be cut off and point in the wrong direction.
-
Label text may occasionally fail to render when using WebGL2 on graphs with a large number of labels. This issue arises from GPU texture size limitations, which can prevent the creation of sufficiently large texture atlases required for high-quality text rendering. It primarily affects devices with constrained GPU resources, such as certain Android devices, where these are more pronounced. To address this, implementing Level of Detail (LOD) rendering based on zoom levels can help reduce the number of labels rendered at lower zoom levels, improving performance and ensuring labels are displayed properly.
-
Arc edges styled with WebGLArcEdgeStyle do not completely support effects on low precision devices. In particular, effects and beacon animations are not rendered for nearly straight edges with WebGLArcEdgeStyle.
-
Polyline edges with smooth bends styled with WebGLPolylineEdgeStyle may render without smoothing on Android devices that lack sufficient
mediumpprecision.
WebGL Troubleshooting
This section explains how to address WebGL rendering issues and low frame rates.
Dealing with Rendering Issues
If some labels or icons are invisible, it may be that yFiles has run out of GPU texture memory. To resolve this issue, try the following:
-
Reduce the number of different labels or icons.
-
Reduce the label size (e.g., use a smaller font size or shorter text).
-
Reduce the icon size.
Other rendering issues, such as invisible elements, artifacts, flickering, or incorrect background colors, often result from outdated software. yFiles is tested with recent versions of Chrome, Edge, Firefox, and Safari. If you encounter rendering issues, ensure that you are using the latest versions of your operating system, graphics card driver, and browser. Note that WebGL2 support in Safari is enabled by default only on iOS 15 and later. On older iOS versions, it is marked as experimental and must be enabled manually.
Dealing with Low Frame Rate
Low frame rates can occur for several reasons. One common reason is that the browser isn’t using the GPU for rendering and instead relies on software emulation to run WebGL code on the CPU. To address this, ensure that hardware acceleration is enabled in the browser’s settings and that your hardware, operating system, and browser combination supports hardware acceleration.
Another cause of poor performance can be a less powerful graphics card. However, even current CPU-integrated GPUs are often capable of smoothly rendering large graphs with 50,000 elements or more. To render graphs significantly larger than 50,000 nodes and edges, a dedicated graphics card may be necessary. If you have multiple graphics cards, verify that the browser is using the most powerful one.
ImageNodeStyle and IconLabelStyle are not auto-converted
The method getWebGLNodeStyle cannot automatically convert instances of ImageNodeStyle to WebGLImageNodeStyle because its image cannot be converted in synchronous code. Similarly, the method getWebGLLabelStyle cannot automatically convert instances of IconLabelStyle to WebGLIconLabelStyle.