Port Styles
Similar to other graph items, the visual appearance of ports is determined by their style.
Since ports are points, they have a location but no size. The visual size of a port is therefore determined entirely by the style implementation.
Predefined Shapes
With the ShapePortStyle class, you can easily display predefined shapes such as ellipses and triangles.
graph.addPort(node, FreeNodePortLocationModel.RIGHT, new ShapePortStyle())
The style supports both a background fill and a border stroke. The shape property lets you specify the desired shape. The available shapes are the same as those available for the ShapeNodeStyle for nodes and are explained in the Predefined Shapes section. The exact size and location can be set using renderSize and offset.
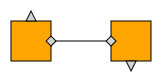
graph.addPort(
  node1,
  new FreeNodePortLocationModel().createParameter(
    node1,
    new Point(0.5, 0.0)
  ),
  new ShapePortStyle({
    offset: { x: 0, y: -5 },
    renderSize: { width: 10, height: 10 },
    fill: 'lightgray',
    shape: 'triangle'
  })
)

graph.addPort(
  node2,
  new FreeNodePortLocationModel().createParameter(
    node1,
    new Point(0.5, 1.0)
  ),
  new ShapePortStyle({
    offset: { x: 0, y: 5 },
    renderSize: { width: 10, height: 10 },
    fill: 'lightgray',
    shape: 'triangle-pointing-down'
  })
)

graph.setStyle(
  edge.sourcePort,
  new ShapePortStyle({
    renderSize: new Size(10, 10),
    fill: 'lightgray',
    shape: 'diamond'
  })
)

graph.setStyle(
  edge.targetPort,
  new ShapePortStyle({
    renderSize: new Size(10, 10),
    fill: 'lightgray',
    shape: 'diamond'
  })
)Using a node style as port visualization
yFiles for HTML provides a large number of styles for rendering nodes. The NodeStylePortStyleAdapter allows you to use these styles to visualize ports. You can set the exact size and location using renderSize and offset.

// configure the node style used by the port
const arrowNodeStyle = new ArrowNodeStyle({
  shape: 'notched-arrow',
  shaftRatio: 1
})

// add a port with the adapted node style
graph.addPort(
  node,
  FreeNodePortLocationModel.RIGHT,
  new NodeStylePortStyleAdapter({
    nodeStyle: arrowNodeStyle,
    renderSize: new Size(8, 6),
    offset: new Point(6, 0)
  })
)Custom Styles
yFiles for HTML offers an abstract style implementation: the PortStyleBase<TVisual>. For a detailed discussion on creating custom styles using this class as a base, see Customizing Styles.
Invisible Ports
The IPortStyle.VOID_PORT_STYLE can be used to make a port invisible, while the port remains in the graph. Additionally, the port will not respond to interactions such as mouse clicks.
graph.setStyle(invisiblePort, IPortStyle.VOID_PORT_STYLE)In yFiles for HTML this is the default style for ports.