Large Graph Performance
This section covers techniques for displaying and editing very large graphs with thousands of elements with yFiles for HTML.
General Considerations
The effectiveness of some of the techniques outlined below depends on the graph structure, its layout, and how users will interact with the graph. For example, the performance characteristics of a spacious balloon layout differ from those of a dense hierarchical layout. This is because zooming in on a spacious layout leaves fewer elements in the viewport.
To achieve good performance, it’s often necessary to test with the actual graph and adjust parameters or solutions accordingly. The suggestions and techniques below address common bottlenecks. In addition, using a profiler is highly recommended to identify and resolve performance problems.
Graph Size
Without dedicated optimization techniques, yFiles for HTML usually handles graphs with up to a few hundred elements well. In this section, large graphs refers to graphs containing thousands or tens of thousands of elements.
Before considering performance optimizations for such large graphs, determine if it is strictly necessary to include all elements in a graph simultaneously. In some use cases, the sheer number of potential elements can be handled using alternative methods. For example, consider folding parts of the graph that are not currently the focus of attention or rendering parts of large graphs to bitmaps and displaying those instead of individual nodes.
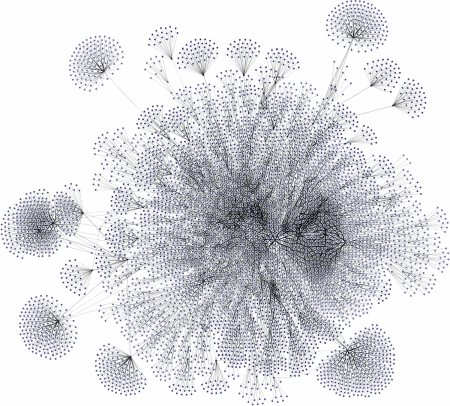
Usability is another important consideration. Depending on the layout and the information displayed, reading very large graphs can be difficult. Displaying all the data at once often results in visual clutter, creating a typical “hairball” graph that might look impressive but provides little insight to the viewer. Trimming the graph to its essential parts often improves both usability and performance.
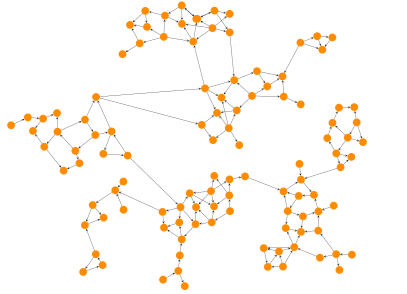
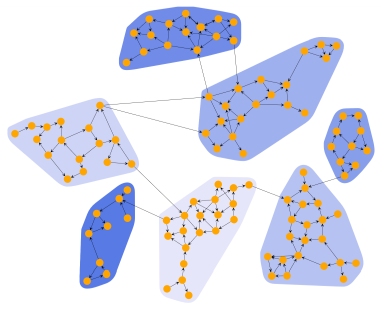
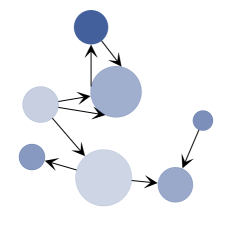
There are several approaches to reduce the complexity of a graph. For example, grouping elements with common properties, analyzing the data for clusters, or showing or hiding subtrees of a tree structure. The node aggregation algorithm automatically clusters the nodes of a given graph and creates a hierarchical clustering structure subject to user-specified constraints.
Some of these techniques, often referred to as “Drill Down”, “Expand/Collapse”, “Filtering”, or “Folding” functionality, are demonstrated in the demo applications Hierarchical Nesting, Collapsible Trees, and Organization Chart.
The focus of this section, however, is on techniques for displaying such large graphs when reducing the graph is absolutely not possible.
Automatic Layout
Calculating layouts for large graphs can take a long time. Putting ten thousand nodes into a graph and running a layout algorithm will usually result in a waiting time of at least half a minute. Most layout algorithms allow you to restrict the maximum execution duration (see, for example, stopDuration). Note that such restrictions may result in a lower layout quality. Furthermore, the actual runtime may exceed the specified value since the layout algorithm still has to find a valid solution. Often, a good option is to run a complete layout only rarely and instead focus on incremental layouts of newly-added elements. The two main layout algorithms suitable for incremental use while keeping interaction fluid are HierarchicalLayout and OrganicLayout. They can both be configured to move only a selected subset of nodes and leave the rest of the graph as is.
The basics of incremental layout are discussed in detail in the Incremental Layout section.
Rendering Technique
yFiles offers different techniques to render visuals: SVG, Canvas, and WebGL2 rendering. The default technique is SVG rendering. SVG rendering offers several advantages, including full customizability, styling with CSS, crisp text rendering, and support for animations and hover effects. However, for very large diagrams, the SVG DOM can become very large, which might result in reduced performance. Canvas generally allows rendering larger graphs while item styling remains fully customizable. WebGL2 rendering offers the best performance but is limited to a built-in set of styles, animations, and user interactions. It is possible to combine the advantages of SVG and WebGL techniques with level of detail rendering: crisp, detailed rendering at high zoom levels and fast, but simpler rendering at low zoom levels.
GraphOverviewComponent
In our demos, you will often find both a regular GraphComponent and a GraphOverviewComponent in a window. The GraphOverviewComponent also has to render the graph, and it still uses styles (albeit simpler ones) and creates visuals for its items. Therefore, updates can be costly with large graphs. The easiest solution to that is to simply disable the overview. However, replacing GraphOverviewComponent with a GraphComponent, using simple styles, following the recommendations below (especially regarding static graphs), and installing an OverviewInputMode is also an option.
GraphEditorInputMode
The GraphEditorInputMode has several sub-modes that each handle different tasks. Because these sub-modes are all active simultaneously, they collectively determine which one is responsible for a particular input event. Two sub-input modes of GraphEditorInputMode are particularly noteworthy: createEdgeInputMode and createBendInputMode. Both of these modes need to determine if they "hit" something when a drag operation begins. They perform hit testing on all model items the moment a drag starts, which can cause a noticeable lag when starting a panning gesture on very large graphs. If this lag becomes problematic and the ability to create edges or bends is not required, the easiest solution is to disable these input modes on GraphEditorInputMode.
// 'graphComponent' is of type GraphComponent
const graphEditorInputMode = new GraphEditorInputMode()
graphEditorInputMode.createEdgeInputMode.enabled = false
graphEditorInputMode.createBendInputMode.enabled = false

graphComponent.inputMode = graphEditorInputModeGraphViewerInputMode is not affected.
Styles
The first optimization to consider when rendering large graphs is the time spent in the styles' updateVisual methods. By default, everything is visible at all zoom levels and rendered in detail. In particular, labels often don’t need to be displayed at low zoom levels, as they are not readable anyway. Furthermore, PolylineEdgeStyle offers visual niceties such as clipping its path to the outline of the end nodes. These details are not visible at low zoom levels either.
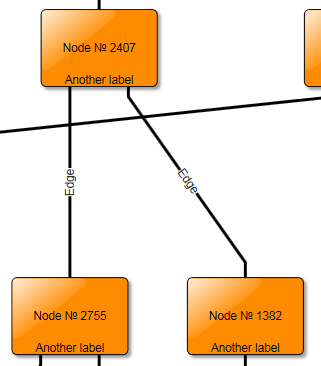
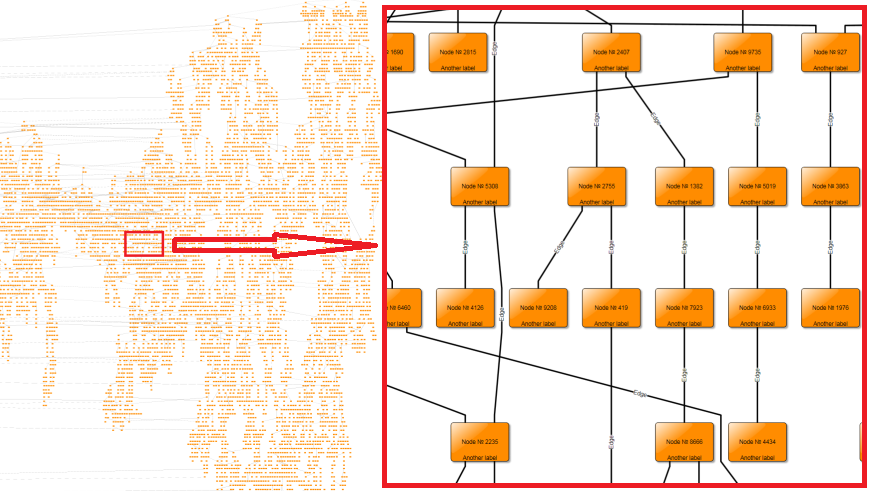
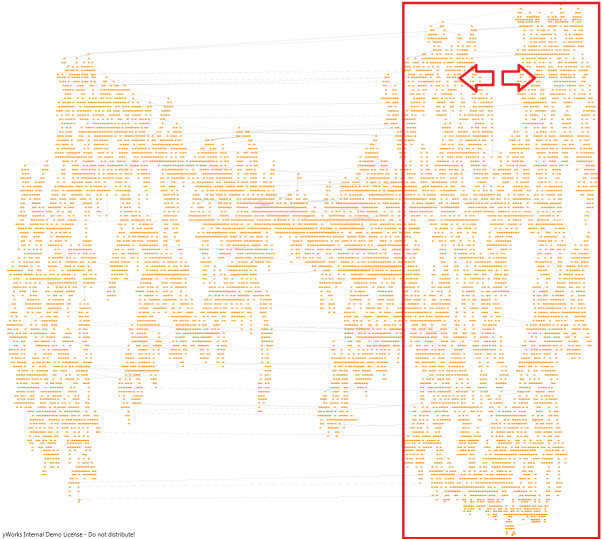
There are two main optimizations for styles: First, you can employ level-of-detail rendering to avoid using expensive styles at low zoom levels where many items are visible. Level-of detail rendering means that complex rendering is used at higher zoom levels, while the visualization is much simpler at low levels. Level-of-detail styles illustrates this: complex rendering is used for high zoom levels (top left picture), while a much simpler rendering is sufficient for low zoom levels (compare the pictures on the right).
| High Zoom Level | Low Zoom Level |
|---|---|
|
|
Detailed rendering at high zoom levels. Visual effects, details, labels, and edge bends are enabled. |
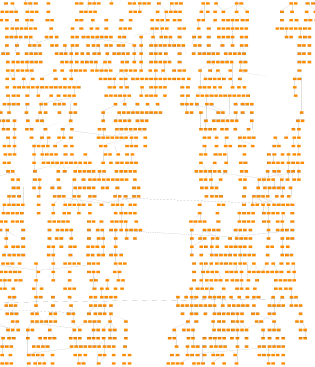
Detailed rendering at low zoom levels. All details are still rendered, but they are too small to be seen. |
|
|
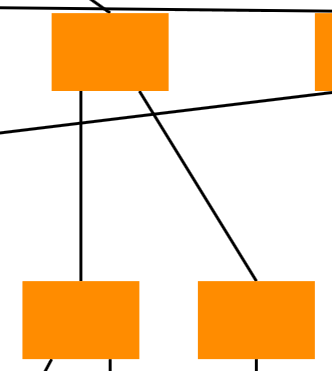
Simple rendering at high zoom levels |
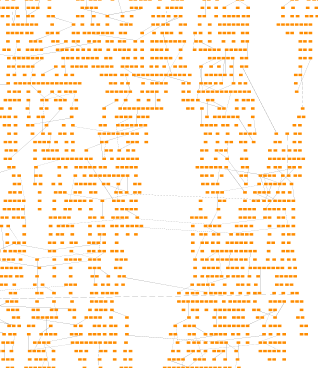
Simple rendering at low zoom levels. Note that at this zoom level, the differences to the detailed rendering (above) are not visible. |
The most efficient styles in this respect are VOID_NODE_STYLE, VOID_EDGE_STYLE, VOID_LABEL_STYLE,
and VOID_PORT_STYLE, which simply hide their respective items.
This is most useful for labels but sometimes also for edges, depending on whether edges are necessary to see the
graph structure. Generally, level-of-detail rendering can offer increasingly complex visualizations for all model items,
depending on the zoom level. For an example, see the following code snippet that uses the LevelOfDetailNodeStyle class from the Level of Detail Style demo.
// 'graph' is of type IGraph.
graph.nodeDefaults.style = new LevelOfDetailNodeStyle(
  new ShapeNodeStyle({
    shape: 'rectangle',
    fill: '#ff6c00'
  }),
  new ShapeNodeStyle({
    shape: 'round-rectangle',
    fill: '#ffc914'
  }),
  new ShapeNodeStyle({
    shape: 'diamond',
    fill: '#17bebb'
  })
)While the void styles are a good way to solve performance problems for lower zoom levels, they have the obvious drawback that they don’t render anything. However, you can easily create dedicated styles that solve the main performance problems in rendering and still convey the shape and position of nodes, edges, and labels. ShapeNodeStyle works well for low-fidelity rendering of nodes. Labels are better hidden when they get too small, but edges lack an out-of-the-box solution for fast low-fidelity rendering.
Possible edge rendering optimizations for low zoom levels are:
-
The edge is not clipped at the node outline. This takes advantage of the fact that edges are drawn below nodes by default, and thus the node’s visual lies above the edge’s. However, if arrows are desired/needed and the ports are not already at the node boundary, then clipping is needed again; otherwise, the arrow will end in the middle of a node. Using a level-of-detail style to switch from an edge style with arrows to one without is a viable option.
-
Edge bends are not rendered, depending on the zoom level, which offers a simpler representation when full fidelity is not needed. This assumes that bends are mostly used for minor deviations from the overall edge shape. If bends are instead used to route an edge a long distance through the graph, this results in a worse visualization. As usual, this depends very much on the graph, and rendering bends even at lower zoom levels doesn’t have a large impact.
-
Very short edges, such as those between close nodes in a cluster of nodes, can be hidden. By taking the zoom level into account, you can consider the actual on-screen length of the edge. In large graphs with many nodes that are close to each other and connected, this can prevent most edges from being rendered at all.
The FastEdgeStyle in the Graph Viewer demo
demonstrates how all these optimizations can be implemented.
The demo also includes a FastLabelStyle that can be used as an intermediary style between
VOID_LABEL_STYLE and LabelStyle. The actual bottleneck with labels is
a different one, though — calculating their position and layout,
especially with edge labels. This is further explored in Static Graphs.
For now, the best advice is to keep
edge labels hidden as long as possible, which nicely correlates to the fact that edge labels can add a lot of
visual noise at lower zoom levels and thus are not even very useful to show.
Virtualization
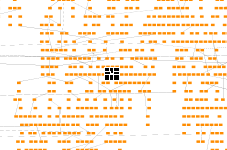
Virtualization in CanvasComponent trims the DOM to include only the elements that are currently visible. The benefit of this is clear: after zooming into a small area of the graph, only a few elements remain in the DOM (see Positive and negative aspects of virtualization, left picture). Virtualization works well when a few hundred visuals or fewer need to be removed or added at a time. However, it can result in significant stutter if thousands of elements are affected. This typically happens while panning or zooming the viewport with a large graph at a low zoom level. (See Positive and negative aspects of virtualization, right picture: when the graph is panned to the right, all elements that are moved outside the viewport must be removed from the DOM. This can considerably slow down the panning.)
There is no easy solution to this, as virtualization is both necessary at higher zoom levels and a burden at lower zoom levels. Turning off virtualization below a given zoom level improves the panning performance of the viewport, but it can create a noticeable delay when crossing the zoom level threshold while zooming in either direction. This delay occurs because when crossing the threshold, all elements suddenly need their visuals created, even if they are outside the viewport. The exact threshold value thus needs to be determined empirically with the graph in question to find a suitable trade-off between pause length while zooming and frame rate while panning.
Virtualization depends on whether a style’s IVisibilityTestable
considers an item visible. If an item’s
visibility changes to false, it will be removed from the DOM and re-created and added again when it becomes
visible again. So, to turn off virtualization (i.e., never remove items from the DOM), we just need to consider
an item always visible, as seen in Turning off virtualization in a style that derives from NodeStyleBase<TVisual>.
isVisible(
  context: ICanvasContext,
  rectangle: Rect,
  node: INode
): boolean {
  if (context.zoom < 0.1) {
    return true
  }
  return super.isVisible(context, rectangle, node)
}To make this behavior configurable, style decorators for node, edge, and label styles can be used to turn virtualization off at a configurable zoom level. In theory, that functionality could be integrated directly into the level-of-detail styles as well.
Selections
Large graphs, especially editable ones, sometimes require making large selections. Two default behaviors can hinder this:
-
Drawing selection handles can be resource-intensive, especially when hundreds or thousands of items are selected.
-
The default selection decoration involves an additional visual element and two coordinate system transformations, which can be costly with many selected items.
Displaying thousands of selection handles that obscure the graph and hinder interaction is not ideal. Therefore, selection handles should be disabled in the input mode. Depending on the specific needs, this choice can be made based on the number of selected items or the current zoom level. However, toggling handles on or off requires re-checking all selected items to determine if handles should be shown (by calling requeryHandles), which can be slow.
// 'geim' is of type GraphEditorInputMode

// disabling selection handles
geim.showHandleItems = GraphItemTypes.NONE
// enabling selection handles
geim.showHandleItems = GraphItemTypes.ALLCustom selection decorations can be set on the GraphDecorator instance obtained from IGraph.decorator. This involves creating a custom style and using one of the StyleIndicationRenderers. The basic steps are shown in Setting a custom node selection decoration with NodeStyleIndicatorRenderer. For optimal performance, the style should be set up in world coordinates (see the zoomPolicy property of the renderer) and handle necessary adjustments itself. For example, setting the stroke width so that it appears constant in view coordinates by scaling it with the zoom level.
const renderer = new NodeStyleIndicatorRenderer({
  nodeStyle: new FastNodeSelectionStyle(null, new Stroke(Color.RED, 4)),
  zoomPolicy: StyleIndicatorZoomPolicy.WORLD_COORDINATES,
  margins: Insets.EMPTY
})
// 'graph' is of type IGraph.
graph.decorator.nodes.selectionRenderer.addConstant(renderer)Static Graphs
In this section, static graphs refer to graphs and applications where the following statements are generally true:
-
The application primarily functions as a viewer for a given graph. While minor edits to the graph may be possible, global changes, such as interactively moving hundreds of nodes, can be problematic.
-
The graph is largely static and changes infrequently. This might mean that the graph is only modified from a few specific locations in the code, users don’t make many simultaneous edits, and layouts that significantly alter the graph occur infrequently.
These types of applications allow for more aggressive optimizations that can disregard graph changes, because the graph typically remains unchanged or changes only rarely. These optimizations modify the graph or its display by assuming it is static. Changes to the graph may require toggling these optimizations, which can be costly if done frequently. This is the essence of the term "mostly" in the points above.
Label Models
As mentioned before, determining label placement and orientation can be computationally intensive, especially for edge labels. Most label models place the label near the edge and thus need to know the edge’s path to determine where the label is. Sometimes, a tangent to the path is also needed to determine the label’s orientation. Even if a label’s location does not change, this can slow down visual updates on the graph because the label’s style doesn’t know that its location didn’t change.
The easiest approach here is to replace the label models with a FreeLabelModel, which, instead of storing the relative position to its owner, records the absolute position and orientation. This means that when queried for its position and bounding box, the label model has much less to do. A code snippet on how to change the label models can be found in Changing all label models in a graph to a FreeLabelModel while retaining their positions.
for (const l of graph.labels) {
  const freeModelFinder = FreeLabelModel.INSTANCE.getContext(l).lookup(
    ILabelModelParameterFinder
  )
  const param = freeModelFinder!.findBestParameter(l.layout)
  graph.setLabelLayoutParameter(l, param)
}The downside of this approach is that if the label’s owner moves or otherwise changes, the label stays at its original position. However, changing the label model back to its previous model uses a similar code as shown in Changing all label models in a graph to a FreeLabelModel while retaining their positions. So, one way of benefiting from better performance when viewing the graph while still allowing edits would be to change the label models back and forth as needed, perhaps even just for the items being manipulated.
IObjectRenderer
Everything rendered by a CanvasComponent is placed in a tree of IRenderTreeElements, each of which has an IObjectRenderer<TRenderTag> that can be queried for objects to perform hit-testing, visibility checks, visual updates, etc. In most respects, this renderer acts as a style, and the default renderer delegates to an item’s style for these operations. To improve performance, the renderer’s visual creator may return the existing visual. The drawback is that updates will not occur. This affects:
-
Level-of-detail styles, which require a call to the internal updateVisual method to function correctly.
-
Item changes (label text, node size or position, edge bends, styles in general) will not be reflected.
As a consequence, updates must be triggered explicitly in response to any event that requires an update. It is up to the custom implementation to determine whether the existing visual is still valid or a re-rendering is needed.