Creating a Simple Web Application
In this section, we will create a basic yFiles for HTML web application: a single page that contains a GraphComponent, the main control for displaying graphs.
|
Note
|
The GraphComponent is the main Component in yFiles for HTML. It displays the graph and provides rich functionality for interaction with the diagram. |
|
Tip
|
The web application will be implemented alongside the demos delivered with the package. Therefore, it is helpful to open the yFiles for HTML package in an IDE of your choice. The package includes pre-configured project settings for JetBrains IDEs and Visual Studio Code. |
Creating the GUI
Before we begin, we recommend creating a folder inside the demos folder where you can put all the files
that we are going to create (e.g., $PathToYfilesPackage/demos-js/MyFirstApp).
First, start by creating a blank HTML page template. Then, add a simple empty div
element to the page (which will later contain the component) and give it a non-zero size via a CSS rule.
yFiles for HTML consists of a set of JavaScript files. In this example, we use import statements with symbolic names to load the JavaScript library files
into the browser. Then, we create a separate JavaScript file (MyFirstApplication.js) which will be
loaded via a <script> tag from our index.html page.
<!doctype html>
<html lang="en">
  <head>
    <meta
      name="viewport"
      content="width=device-width, initial-scale=1.0, user-scalable=no"
    />
    <title>yFiles for HTML Sample Web App</title>
    <!-- supply some sane defaults for the graph component and page -->
    <style>
      html,
      body,
      #graphComponent {
        width: 100%;
        height: 100%;
        padding: 0;
        margin: 0;
      }
    </style>
  </head>
  <body>
    <div id="graphComponent"></div>
    <script
      type="module"
      crossorigin="anonymous"
      src="MyFirstApplication.js"
    ></script>
  </body>
</html>import { GraphComponent, License } from '@yfiles/yfiles'
License.value = {
/* <add your license information here> */
}
const graphComponent = new GraphComponent('#graphComponent')|
Important
|
For the symbolic names to be resolved to actual files, the application needs preprocessing, e.g., by the demo server included in the package. Please refer to the Demo Server section on how to set it up and to learn about alternatives. |
|
Note
|
A valid license needs to be present to use yFiles for HTML. In this introduction, we place the license data in our JavaScript source code file. However, in the demos, the license is placed in a separate file for the sake of simplicity. More details on how to load the license can be found in Licensing. |
Importing the yFiles for HTML library
You can load yFiles for HTML by using an import statement:
import { GraphComponent } from '@yfiles/yfiles'
const graphComponent = new GraphComponent()Importing symbolic modules like in the above snippets requires either working import-maps, or some preprocessing to resolve the symbolic names for the browser. The yFiles for HTML package uses Vite to serve the demos.
The advantage of using symbolic imports is their seamless integration in modern web application tooling and the out-of-the-box available IDE support.
Nevertheless, you can avoid the necessary preprocessing by importing JS Modules from the actual JavaScript file in browsers that support native JS Module imports:
import { GraphComponent } from '../../node_modules/@yfiles/yfiles/yfiles.js'
const graphComponent = new GraphComponent()Adding the Main Component
Continue by adding a GraphComponent instance to the top-level container. The GraphComponent is one of the most central classes of yFiles for HTML and is used for displaying and editing graphs.
Initialize the GraphComponent using a CSS selector or id to tell it which existing div element to use:
const graphComponent = new GraphComponent('#graphComponent')The basic yFiles for HTML application is complete now. The source of this application should look like the code below. For our first web application, we use JS Module loading.
<!doctype html>
<html lang="en">
  <head>
    <meta
      name="viewport"
      content="width=device-width, initial-scale=1.0, user-scalable=no"
    />
    <title>yFiles for HTML Sample Web App</title>
    <!-- supply some sane defaults for the graph component and page -->
    <style>
      html,
      body,
      #graphComponent {
        width: 100%;
        height: 100%;
        padding: 0;
        margin: 0;
      }
    </style>
  </head>
  <body>
    <div id="graphComponent"></div>
    <script
      type="module"
      crossorigin="anonymous"
      src="MyFirstApplication.js"
    ></script>
  </body>
</html>import { GraphComponent, License } from '@yfiles/yfiles'
License.value = {
/* <add your license information here> */
}
const graphComponent = new GraphComponent('#graphComponent')Now open the web page in your browser. You should see an empty white canvas filling the complete display area. It will probably look like an empty web page; however, it may display a license notice at the bottom left, and if you use the mouse wheel in the empty area, you will see that scroll bars will appear.
|
Tip
|
In anticipation of the tutorial step User Interaction:
you can enable graph editing by inserting this line of code:
|
|
Note
|
In the following sections, we’ll insert code snippets into the application step-by-step. At the end of each section, we’ll summarize the source code created so far. |
Creating Graph Elements
In this section, you will learn how to create graph elements in yFiles for HTML. We will create a small sample graph that will be displayed immediately after the application starts. The graph class and its features are discussed thoroughly in the chapter The Graph Model.
|
Note
|
The graph is modeled by the IGraph interface. Instances of this interface hold the graph model itself and provide methods to create, change, and remove graph elements. You can obtain an instance of IGraph from the GraphComponent. A graph consists of different types of elements. Nodes and edges are modeled by instances of INode and IEdge, respectively. Further element types are labels (ILabel) which add textual information to nodes and edges. Finally, ports (IPort) serve as connection points of edges to nodes or other edges, and bends (IBend) provide control points for edges. IGraph provides factory methods to create all kinds of graph elements. |
A newly created GraphComponent instance already holds an implementation of the IGraph interface. This instance is the graph that the GraphComponent will display. You can access it via the graph property.
Insert the following line after the initialization of the GraphComponent:
const graph = graphComponent.graphCreating Nodes
The way to create new nodes is using IGraph’s createNode method. Let’s create some nodes at different locations and with different sizes:
import { Rect } from '@yfiles/yfiles'
const node1 = graph.createNode(new Rect(0, 0, 30, 30))
const node2 = graph.createNode(new Rect(100, 0, 30, 30))
const node3 = graph.createNode(new Rect(300, 300, 60, 30))|
Note
|
See the 01 Create Graph on how to use GraphBuilder for another quick way to build your graph from data. |
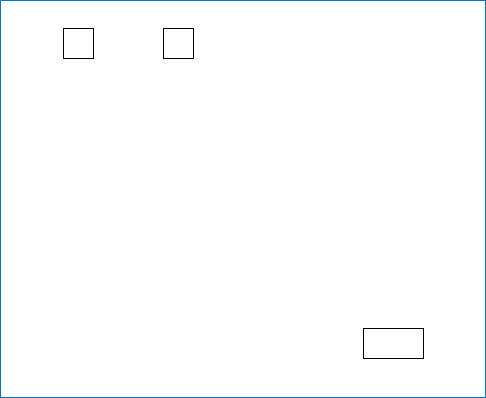
That’s a good start, but it could be better. At the very least, the graph should be centered in the display. Fortunately, GraphComponent provides a method to fit the graph so that it is centered in the display: fitGraphBounds. Call this method after creating all graph elements and after the GUI has been created:
graphComponent.fitGraphBounds()By default, a node is displayed as a white rectangle with a black border. Thus, the diagram with three nodes currently looks like this:
Creating Edges
A graph consists of a set of nodes and a set of edges that define the relationships between the nodes.
Let’s connect the nodes with some edges. To do this, use IGraph's
createEdge method to
connect node1 with node2 and node2 with node3:
const edge1 = graph.createEdge(node1, node2)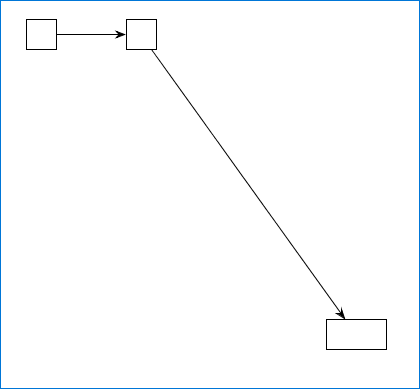
const edge2 = graph.createEdge(node2, node3)The first node of an edge is called the source node, and the second node is called the target node.
Now we have a graph with three nodes and two edges connecting them. By default, an edge is drawn with black, straight line segments. The result should look like this:
Using Bends
Currently, the edges in our diagram are represented by straight lines. yFiles for HTML supports the insertion of bends to create more complex edge paths. Bends are points that subdivide edges into segments. These points are modeled by the interface IBend.
Bends are created for a specific edge using IGraph’s addBend(IEdge, Point, number) method. An edge can have any number of bends.
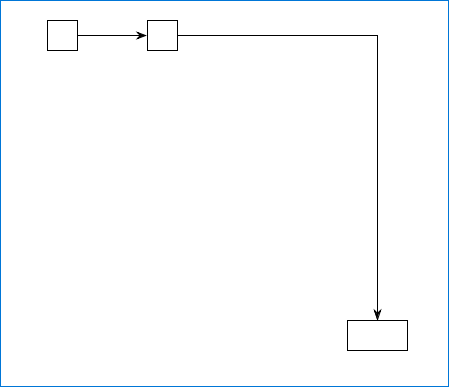
The following line adds a bend to the edge edge2. The coordinates are chosen to create an orthogonal
bend at this location.
import { Point } from '@yfiles/yfiles'
const bend1 = graph.addBend(edge2, new Point(330, 15))Our diagram now looks like this:
Using Ports
A port is a graph element to which edges can connect. Ports can be added to nodes or edges (although ports on edges are relatively rare).
In fact, edges always connect to ports, not directly to nodes. You may recall that earlier we connected two nodes using createEdge(INode, INode, IEdgeStyle, Object). However, createEdge implicitly created two ports at the center of the source and target node first, and then connected these ports with the edge.
|
Tip
|
If your use case does not require dedicated port objects, you can simply ignore IPorts and work directly with nodes. In this case, yFiles for HTML automatically creates and removes IPorts as needed. |
If necessary, you can manually create ports on nodes and connect edges to them. IGraph’s addPort method creates a port for a given owner. Here are two ways to specify the arguments:
-
addPort(owner, parameter) creates a port for the given node or edge at the location defined by the port location parameter. Placing ports is described in more detail in Placing Ports.
-
addPort(owner) creates a new port for the given owner node or edge with the default port location parameter (the port is located at the center of the node).
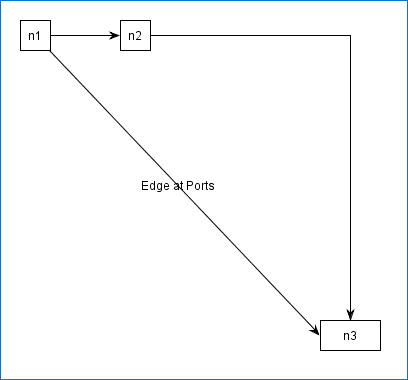
Finally, we create a new edge between the newly created ports:
import { FreeNodePortLocationModel } from '@yfiles/yfiles'
const portAtNode1 = graph.addPort(node1)
const portAtNode3 = graph.addPort(node3, FreeNodePortLocationModel.LEFT)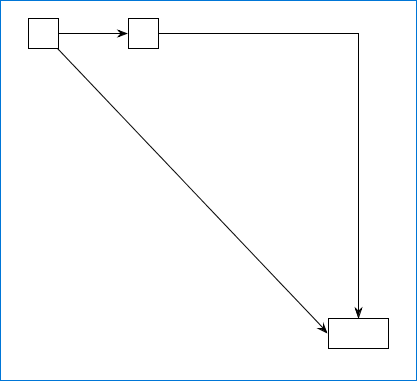
const edgeAtPorts = graph.createEdge(portAtNode1, portAtNode3)By default, ports are invisible. However, because portAtNode3 has a dedicated port location parameter,
the new edge points to the middle of the left side of its target node instead of its center:
Adding Labels
It is common to add supplemental information to a graph and its elements. Textual information can be represented by labels, which are implementations of ILabel. Similar to bends and ports, labels are added to nodes, edges, and ports via the graph, using IGraph’s addLabel method. Each label owner can have multiple labels.
To add labels to your graph items, add the following lines to your initialization code and reload the page:
const ln1 = graph.addLabel(node1, 'n1')
const ln2 = graph.addLabel(node2, 'n2')
const ln3 = graph.addLabel(node3, 'n3')
const le3 = graph.addLabel(edgeAtPorts, 'edgeAtPorts')Similar to ports, labels are typically placed relative to their owner element by specifying a specific label model parameter. This is described later in this tutorial in Placing Labels.
Removing Elements
You can remove any element from the graph using its remove(IModelItem) method.
Keep in mind that when you remove an element, all elements that depend on it will also be removed.
For example, if you remove a node, all edges connected to that node will be removed as well. Additionally, all of the node’s labels and ports will be removed, too.
The dependent elements are removed before the element they depend on. This ensures that the graph is always in a consistent state.
Summary of Creating Elements
The code snippets in this section build the example page, culminating in the following source code:
<!doctype html>
<html lang="en">
  <head>
    <meta
      name="viewport"
      content="width=device-width, initial-scale=1.0, user-scalable=no"
    />
    <title>yFiles for HTML Sample Web App</title>
    <!-- supply some sane defaults for the graph component and page -->
    <style>
      html,
      body,
      #graphComponent {
        width: 100%;
        height: 100%;
        padding: 0;
        margin: 0;
      }
    </style>
  </head>
  <body>
    <div id="graphComponent"></div>
    <script
      type="module"
      crossorigin="anonymous"
      src="MyFirstApplication.js"
    ></script>
  </body>
</html>import {
FreeNodePortLocationModel,
GraphComponent,
License,
Point,
Rect
} from '@yfiles/yfiles'
License.value = {
/** <add your license information here> */
}
const graphComponent = new GraphComponent('#graphComponent')
const graph = graphComponent.graph
const node1 = graph.createNode(new Rect(0, 0, 30, 30))
const node2 = graph.createNode(new Rect(100, 0, 30, 30))
const node3 = graph.createNode(new Rect(300, 300, 60, 30))
const edge1 = graph.createEdge(node1, node2)
const edge2 = graph.createEdge(node2, node3)
const bend1 = graph.addBend(edge2, new Point(330, 15))
const portAtNode1 = graph.addPort(node1)
const portAtNode3 = graph.addPort(node3, FreeNodePortLocationModel.LEFT)
const edgeAtPorts = graph.createEdge(portAtNode1, portAtNode3)
const ln1 = graph.addLabel(node1, 'n1')
const ln2 = graph.addLabel(node2, 'n2')
const ln3 = graph.addLabel(node3, 'n3')
const le3 = graph.addLabel(edgeAtPorts, 'edgeAtPorts')
graphComponent.fitGraphBounds()User Interaction
In this section, you will learn how to enable the default user interaction capabilities. Almost every aspect of user interaction can be configured and customized to fit your needs. This is discussed in detail in the chapters User Interaction and Customizing User Interaction.
|
Note
|
User interaction is enabled by setting an input mode to the GraphComponent. yFiles for HTML provides a comprehensive input mode that enables the most common tasks for editing graphs: the GraphEditorInputMode. |
If you have already looked at the demos that come with yFiles for HTML, you may have noticed that the user can often drag nodes around with the mouse and can add and remove nodes, edges, and bends. If you tried to click and drag in the example web page, nothing happened. This will change now.
Create a new instance of the GraphEditorInputMode class and set it as the GraphComponent’s input mode using the inputMode property. In the example web page, add the following line after the instantiation of the GraphComponent:
import { GraphEditorInputMode } from '@yfiles/yfiles'
graphComponent.inputMode = new GraphEditorInputMode()In yFiles for HTML, interaction is handled by input modes. The GraphEditorInputMode class is the main input mode and is pre-configured to handle the most common tasks, such as moving, deleting, creating, and resizing graph elements. Although there are many other input modes, these are mostly tailored for specific tasks and are often automatically invoked by GraphEditorInputMode when needed.
Adding GraphEditorInputMode enables the following features and more:
-
Selecting a single element by clicking it. Hold Alt to step through different elements at the same location (for example, a node label inside its owner). To select multiple elements, either extend an existing selection by pressing Ctrl while clicking, or drag a selection rectangle over all graph elements that you want to select. Ctrl+A selects all elements.
-
Resizing nodes. Drag one of the handles that appear when a node is selected.
-
Moving a node or a bend by dragging it when it is selected.
-
Creating an edge. Start dragging anywhere on an unselected source node and stop dragging on the target node.
-
Creating a bend in an edge. Click and drag the edge at the desired bend location.
-
Creating or editing a label. Press F2 when the label’s owner is selected.
-
Moving a label. Select it and drag it to the desired location. Note that the valid positions are restricted by the label model of the label. These positions are indicated by empty rectangles when you start dragging the label. You can only move a label to one of these positions.
Setting Styles
In this section, you will learn how to change the visual appearance of graph elements. This is described in detail in the sections Visualization of Graph Elements: Styles and Customizing Styles.
|
Note
|
The rendering of graph elements of all kinds, except bends, is handled by styles. Style implementations are type-specific. For example, a node is rendered by an INodeStyle, and an edge by an IEdgeStyle. |
In a typical diagram, the visualization of the nodes and other elements must be customized to convey information or to be more visually appealing than the monochrome shapes we have used so far.
In yFiles for HTML, all kinds of graph elements (nodes, edges, labels, ports, but not bends) have a style which is responsible for rendering the element. For example, for nodes, the interface INode has a style property with the type INodeStyle.


|
Note
|
You do not have to rely on the predefined styles. yFiles for HTML makes it easy to implement your own style that perfectly fits your needs. See chapter Customizing Styles to learn more about this. |
The style of a graph element can be set at creation time, or changed at any time afterward with the setStyle methods of IGraph. In any case, graph elements must always have a non-null style.
All creation methods support a style parameter:
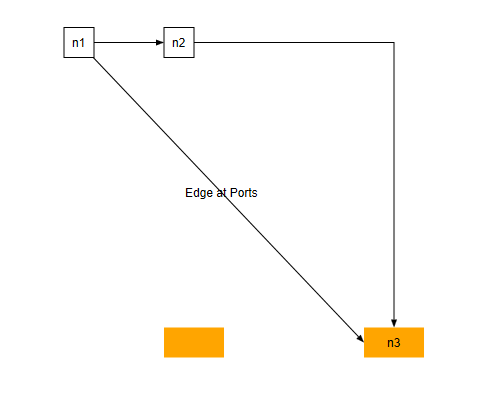
For example, to set the style of some nodes to a flat orange rectangle without a border, you can use the following code:
import { ShapeNodeStyle } from '@yfiles/yfiles'
// create a style which draws a node as a geometric shape with a fill and a transparent border color
const orangeNodeStyle = new ShapeNodeStyle({
  shape: 'rectangle',
  fill: 'orange',
  stroke: 'transparent'
})

// change the style of an already created node
graph.setStyle(node3, orangeNodeStyle)

// set a custom style at node creation
const node4 = graph.createNode(new Rect(200, 80, 60, 30), orangeNodeStyle)Now, the diagram has two orange nodes:
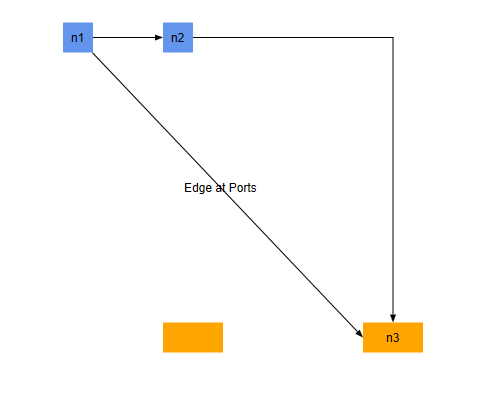
If the style of an element is not specified explicitly, a default style will be used. The default style is not hard-coded in the library. Rather, it can be set as part of a number of default properties for each kind of graph item. This is discussed in detail in the section Setting Defaults for New Items.
For nodes, the default style can be set using the NodeDefaults class in the following way:
const blueNodeStyle = new ShapeNodeStyle({
  fill: 'cornflower_blue',
  stroke: 'transparent'
})

graph.nodeDefaults.style = blueNodeStyleChanging the default style will not affect already created nodes. Therefore, this line should be inserted before the creation of the nodes.
As a result, we get two blue nodes and two orange nodes:
With the additions for setting the node styles, the source code of the example web page is this:
<!doctype html>
<html lang="en">
  <head>
    <meta
      name="viewport"
      content="width=device-width, initial-scale=1.0, user-scalable=no"
    />
    <title>yFiles for HTML Sample Web App</title>
    <!-- supply some sane defaults for the graph component and page -->
    <style>
      html,
      body,
      #graphComponent {
        width: 100%;
        height: 100%;
        padding: 0;
        margin: 0;
      }
    </style>
  </head>
  <body>
    <div id="graphComponent"></div>
    <script
      type="module"
      crossorigin="anonymous"
      src="MyFirstApplication.js"
    ></script>
  </body>
</html>import {
FreeNodePortLocationModel,
GraphComponent,
GraphEditorInputMode,
License,
Point,
Rect,
ShapeNodeStyle
} from '@yfiles/yfiles'
License.value = {
/* <add your license information here> */
}
const graphComponent = new GraphComponent('#graphComponent')
const graph = graphComponent.graph
const blueNodeStyle = new ShapeNodeStyle({
fill: 'cornflower_blue',
stroke: 'transparent'
})
// newly, interactively created nodes will be blue
graph.nodeDefaults.style = blueNodeStyle
const node1 = graph.createNode(new Rect(0, 0, 30, 30))
const node2 = graph.createNode(new Rect(100, 0, 30, 30))
const node3 = graph.createNode(new Rect(300, 300, 60, 30))
const edge1 = graph.createEdge(node1, node2)
const edge2 = graph.createEdge(node2, node3)
const bend1 = graph.addBend(edge2, new Point(330, 15))
const portAtNode1 = graph.addPort(node1)
const portAtNode3 = graph.addPort(node3, FreeNodePortLocationModel.LEFT)
const edgeAtPorts = graph.createEdge(portAtNode1, portAtNode3)
const ln1 = graph.addLabel(node1, 'n1')
const ln2 = graph.addLabel(node2, 'n2')
const ln3 = graph.addLabel(node3, 'n3')
const le3 = graph.addLabel(edgeAtPorts, 'edgeAtPorts')
graphComponent.fitGraphBounds()
graphComponent.inputMode = new GraphEditorInputMode()
// create a style which draws a node as a geometric shape with a fill and a transparent border color
const orangeNodeStyle = new ShapeNodeStyle({
shape: 'rectangle',
fill: 'orange',
stroke: 'transparent'
})
// change the style of an already created node
graph.setStyle(node3, orangeNodeStyle)
// set a custom style at node creation
const node4 = graph.createNode(new Rect(200, 80, 60, 30), orangeNodeStyle)Placing Graph Elements
In this section, you will learn how to explicitly place individual graph elements at specific locations. All details about placing graph elements are provided in Item Layout.
The outstanding automatic graph layout features of yFiles for HTML are discussed later in Automatic Graph Layout.
|
Note
|
A node’s geometry, its layout, is described by a rectangle that defines the position and size of the node. An edge does not inherently contain information about its geometry. Its path is defined by the location of its source and target ports, as well as the number and location of its bends. A label’s geometry is described by a label model parameter, which usually defines its position relative to the label’s owner; see also Labels. Similarly, a port’s position is described by a port location model parameter (see Ports). |
Placing Nodes
A node’s size and location — its layout or bounding box — is defined by INode’s layout, which represents a rectangle.
Regarding the node layout, there are two different ways to specify it when using the createNode method:
- IGraph.createNodeAt(point)
-
Creates a node at the provided location with the default size. Note that the point specifies the location of the center of the node, not the top left corner.
- IGraph.createNode()
-
Creates a node at the default location (0,0) with the default size. This is mainly useful in combination with an automatic layout which calculates better locations for nodes.
To change the location or size of existing nodes, you can use the following methods:
- IGraph.setNodeCenter(INode, Point)
-
Sets the center of the provided node to the provided location.
- IGraph.setNodeLayout(INode, Rect)
-
Sets the location and size of the provided node to the provided rectangle.
Placing Bends
A bend’s location is defined by the IBend’s location property as a point with absolute coordinates.
You can set the bend location:
-
For a new bend, by providing its initial absolute coordinates to IGraph.addBend(edge: IEdge, location: Point, index: number): IBend
-
For an existing bend, by providing its new absolute coordinates to IGraph.setBendLocation(bend: IBend, location: Point): void
Placing Labels
Usually, the location of a label is not specified by coordinates. Instead, its location is defined relative to its owner element with the help of a label model parameter. Different label model parameters and their usage are discussed in detail in section Labels.
Label model parameters can be set in the following ways:
-
When creating a new label, by providing a label model parameter to IGraph.addLabel(ILabelOwner, string, ILabelModelParameter, ILabelStyle, Size, Object).
-
For an existing label, by providing a label model parameter to IGraph.setLabelLayoutParameter(ILabel, ILabelModelParameter).
-
By changing the defaults. Note that the defaults for labels, modeled by ILabelDefaults, are not provided as a property of IGraph but as properties of the node and edge defaults.
Placing Ports
Similar to labels, ports are typically placed relative to their owner, and their location is determined by a port location model parameter. A detailed discussion of different port location parameters and their usage can be found in Ports.
You can set port location model parameters in the following ways:
-
For a new node, provide a port location model parameter to IGraph.addPort(IPortOwner, IPortLocationModelParameter, IPortStyle, Object).
-
For an existing port, provide a port location model parameter to IGraph.setPortLocationParameter(IPort, IPortLocationModelParameter).
-
by changing the defaults. Note that the defaults for ports, modeled by IPortDefaults, are not provided as property of IGraph but as property of the node defaults and edge defaults.
Automatic Graph Layout
In this section, you will learn how to automatically arrange a graph using one of the automatic graph layout styles provided by yFiles for HTML. The chapter Automatic Layouts introduces all layout styles of yFiles for HTML and thoroughly explains their configuration options.
|
Note
|
yFiles for HTML can automatically arrange your diagram using all major graph layout styles, including hierarchical, organic, tree, orthogonal, and circular styles. The IGraph and GraphComponent classes provide convenient methods to apply these algorithms to the graph with a single method call. |
An important part of diagram creation is arranging its elements in a way that not only presents the elements clearly and readably, but also emphasizes their structural characteristics, such as clustering or a flow direction. yFiles for HTML provides a wide range of different layout styles suitable for different application fields.
The most important layout styles are shown below:
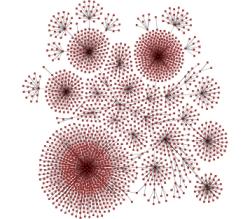
Besides these layout styles, yFiles for HTML offers further layout algorithms as well as algorithms to route edges and place labels without altering the node layout.
In this example, we use a force-directed layout, implemented by the OrganicLayout class, and slightly alter its default settings:
const layout = new OrganicLayout({ defaultMinimumNodeDistance: 50 })The easiest way to automatically arrange a diagram is to use one of the following methods:
-
applyLayout works on an IGraph and applies the layout in a blocking call. When the method returns, all elements in the graph are already arranged at their final coordinates.
-
applyLayoutAnimated applies the specified layout algorithm to the GraphComponent’s graph and offers some more features: The new layout is (optionally) applied in an animated fashion, and the final arrangement is centered in the GraphComponent similar to the fitGraphBounds method.
|
Note
|
To customize the animation from the old to the new layout, use the LayoutExecutor class instead of applyLayoutAnimated. See section Applying an Automatic Layout for details. |
Add the following line of code at the end of your file to lay out the example diagram once during
initialization of the web app. Note that the LayoutExecutor is required for this
internally and to prevent some automatic bundlers from omitting that functionality from the bundle, we need to ensure
that it is there when we want to apply a layout to an IGraph via the applyLayout and applyLayoutAnimated utility functions.
// Ensure that the LayoutExecutor class is not removed by build optimizers
// It is needed for the 'applyLayoutAnimated' method in this demo.
LayoutExecutor.ensure()

try {
  await graphComponent.applyLayoutAnimated(layout)
  alert('Done!')
} catch (e) {
  alert(`An error occurred during layout ${e}`)
}// Ensure that the LayoutExecutor class is not removed by build optimizers
// It is needed for the 'applyLayoutAnimated' method in this demo.
LayoutExecutor.ensure()
try {
await graphComponent.applyLayoutAnimated(layout)
alert('Done!')
} catch (error) {
alert(`An error occurred during layout ${error}`)
}In the next subsection, we will create a toolbar button that calculates a layout on demand. Skip to the next section Loading and Saving Graphs if you do not need this.
Adding a Layout Button
In this section, we will add a simple HTML button interface to the web page to execute the automatic layout.
First, we add a button to the page. Since applyLayoutAnimated calculates and morphs the layout asynchronously, we disable the button before the calculation starts and re-enable it after the layout (and the subsequent animation) has finished. Invoking code after the layout — that’s where return type Promise of the applyLayoutAnimated method comes in handy:
Then, we add this code to the button to update the web page:
Loading and Saving Graphs
Details about loading and saving graphs, as well as image export and printing, are discussed in detail in the chapter Graph I/O and Printing.
yFiles for HTML has built-in support for saving and loading diagrams in the GraphML format. GraphML is an XML-based format that stores all aspects of a diagram, including the graph elements, their appearance, and optionally any custom data.
Next Steps
In this short tutorial, you learned about the most important concepts of yFiles for HTML and how to use them in a simple web application. The rest of this development guide describes the various features in detail.
To gain a more in-depth knowledge of yFiles for HTML in an exploratory manner, please have a look at the various demos and tutorials contained in the package.