Tabular Layout
The TabularLayout class is a layout algorithm that arranges nodes in a tabular fashion.
The TabularLayout can be used to produce simple tabular or grid-like layouts of nodes:
-
Each table cell contains at most one node.
-
The connectivity of nodes is ignored.
-
The edges are not routed.
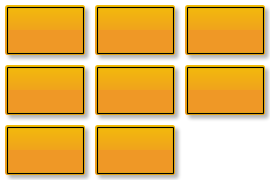
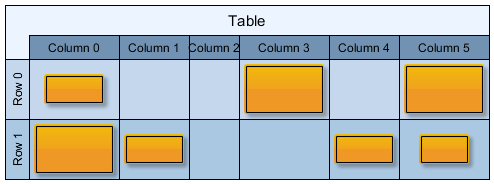
Sample layout by TabularLayout: a simple table with three rows and three columns shows an example result. The layout contains eight nodes arranged in a 3x3 table. Sample layout by TabularLayout: a table with two rows and six columns shows a layout with seven nodes organized in a 2x6 table. In this case, some cells are empty, leaving gaps in the table. The second example also visualizes the table cells.
For algorithms that support more complex tabular layouts with edge routing, see Tables and Swimlanes.
Relation to Layout Grid
The LayoutGrid class represents a general API for table layouts in yFiles; see also Tables and Swimlanes. The algorithm TabularLayout described here uses that API but doesn’t necessarily rely on it. Depending on the scenario, you don’t need to define a LayoutGrid instance on the input graph.
The Auto-Size and From-Sketch layout modes don’t require an existing LayoutGrid. So, if you only want to arrange nodes in a tabular fashion, a grid instance isn’t necessary. For example, see Sample layout by TabularLayout: a simple table with three rows and three columns, where the table itself isn’t visualized.
A LayoutGrid is required, independent of the layout mode, if:
-
The table itself should be visualized (as nodes or by other means), for example, as shown in Sample layout by TabularLayout: a table with two rows and six columns, because the coordinates of the rows and columns and their sizes can be retrieved from it.
-
Specific settings, like minimum height/width for a specific row/column, should be obeyed, as these settings are bound to LayoutGridRow or LayoutGridColumn objects defined on the LayoutGrid instance.
|
Note
|
When using the TableLayoutConfigurator class to create the LayoutGrid from a Table instance, you must specify the Fixed Size layout mode. |
If required, use the corresponding layout data TabularLayoutData class and its layoutGridData property to define the layout grid information. You can create a data class instance using the factory method createLayoutData.
Layout Modes
The property layoutMode represents an important setting that you should choose based on your specific use case.
The mode affects the size of the table, specifically the number of rows and columns. Also, depending on the mode, the configuration of a LayoutGrid instance registered with the input graph is either used or ignored.
The available modes are described below.
Auto-Size
Mode AUTO_SIZE automatically determines the table size based on the number of nodes in the input graph. The size is chosen to make the row and column counts as similar as possible, resulting in a table that is as square as possible (the actual node sizes are not considered).
For example, a graph with 16 nodes will result in a table with four rows and four columns.
If a LayoutGrid is registered with the input graph, only the settings of the first row/column are used as template settings. This means that settings like insets and minimum width/height are applied to the resulting rows and columns.
Fixed Size
The FIXED_SIZE mode arranges nodes according to the row and column count specified by the LayoutGrid instance defined on the input graph.
Consequently, this mode requires a valid grid to be registered and the grid must contain enough rows and columns to accommodate all nodes. Otherwise, an exception will be thrown.
This mode also enables mapping a node to a specific cell. This allows you to specify that a node should be placed in the row and column with a particular index. To achieve this, use the layout data class and property LayoutGridData<TNode, TEdge, TNodeLabel, TEdgeLabel>.layoutGridCellDescriptors.
|
Important
|
LayoutGridCellDescriptors that span multiple cells are not allowed; each descriptor must correspond to a single cell. |
The following code example demonstrates the fixed size mode. The algorithm is configured to generate a single-column layout.
const graph = getMyGraph()
const tabularLayout = new TabularLayout()
const data = new TabularLayoutData()

// Set the policy to fixed size, as we want to define the dimension of the table/grid ourselves
tabularLayout.layoutMode = 'fixed-size'

// Define an n x 1 layout grid (n rows, 1 column) on the layout grid data of the tabular layout data,
// where n is the number of nodes in the graph. This grid defines the dimension of the tabular layout.
data.layoutGridData.grid = new LayoutGrid(graph.nodes.size, 1)

// Apply the tabular layout algorithm
graph.applyLayout(tabularLayout, data)From-Sketch
Mode FROM_SKETCH considers the coordinates of the nodes in the input graph to create a tabular layout. Nodes are assigned to the same row if a horizontal line can be drawn that intersects both nodes. Similarly, nodes are assigned to the same column if a vertical line can be drawn that intersects both nodes. This strategy works best when the input already resembles a basic table arrangement. It is not recommended that the input graph contains overlapping nodes because the mapping to rows/columns becomes ambiguous.
If a LayoutGrid is defined, the settings of the first row and column are used as template settings. That is, settings like insets and minimum width/height are transferred to the resulting rows and columns.
Basic Options
Besides the layout mode described in the previous section, there are more basic settings that allow you to customize the result produced by TabularLayout.
Node Descriptor
You can specify node-related options using the TabularLayoutNodeDescriptor class.
For example, you can define the desired horizontal or vertical alignment of nodes within their respective columns and rows. The TabularLayout holds a descriptor instance that provides the default settings:
- defaultNodeDescriptor
-
The default node-related layout options
In addition to the default descriptor, you can associate node descriptors with individual nodes to define different settings for them. You can conveniently set individual descriptors for nodes via the layout data property nodeDescriptors.
Grid-related Settings
TabularLayout respects settings defined on LayoutGridRow and LayoutGridColumn instances bound to the (optional) LayoutGrid.
The following properties are respected:
- topPadding
-
The distance maintained between the top border of the row and the nodes within the row.
- bottomPadding
-
The distance maintained between the bottom border of the row and the nodes within the row.
- minimumHeight
-
The minimum height of the row.
- leftPadding
-
The distance maintained between the left border of the column and the nodes within the column.
- rightPadding
-
The distance maintained between the right border of the column and the nodes within the column.
- minimumWidth
-
The minimum width of the column.
More General Settings
There are several additional settings that are not discussed explicitly here. See the following list for an overview; consult the respective API documentation for details.
- freeNodeComparator
-
Used to sort the nodes in Auto-Size mode and the free nodes in Fixed Size mode.
- considerEdges
-
Considering edges means that the algorithm applies a heuristic approach that favors an arrangement of the free nodes that results in a shorter total edge length.
- nodeLabelPlacement
-
Setting to control if and how node labels are considered. The default is CONSIDER.
- edgeLabelPlacement
-
Setting to control if and how edge labels are considered. The default is GENERIC.