Glossary
A, B, C, D, E, F, G, H, I, J, K, L, M, N, O, P, Q, R, S, T, U, V, W, X, Y, Z
A
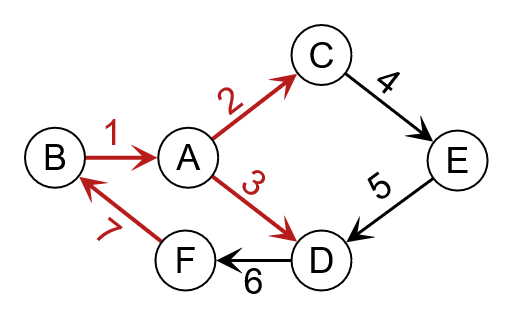
Acyclic
An acyclic graph contains no path of edges that starts and ends at the same node.
Adjacent, Adjacency
Nodes are adjacent if they are connected by an edge.
Edges are adjacent if they share a common node.
Arc
Another name for edge.
B
Bend
A bend is part of the visual representation of an edge. It specifies the coordinates where two segments of the edge connect.
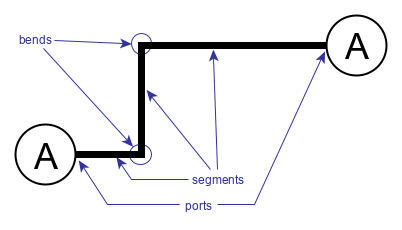
The topology of an edge is determined by the locations of its ports and bends.
BPMN, Business Process Model and Notation
A business process management diagram is a diagram that visualizes the business processes within an organization.
A BPMN diagram consists of a standardized set of visual elements and connections.
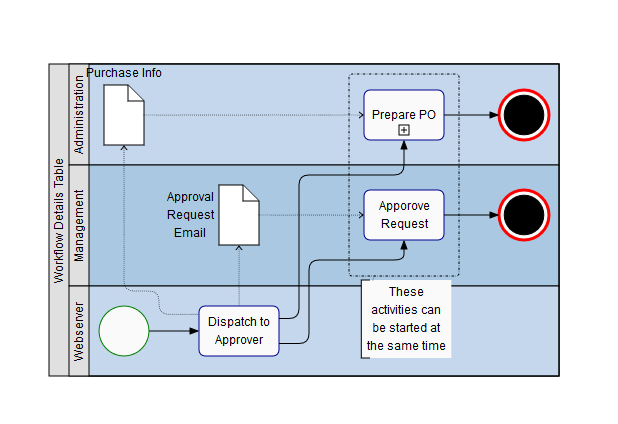
The hierarchical structure of a BPMN diagram makes it suitable for arrangement with a hierarchical layout. Pool nodes, or swim lanes, can be modeled using table nodes. The BPMN Editor demo shows both visual features and automatic arrangement capabilities.
Branch
Another name for edge.
C
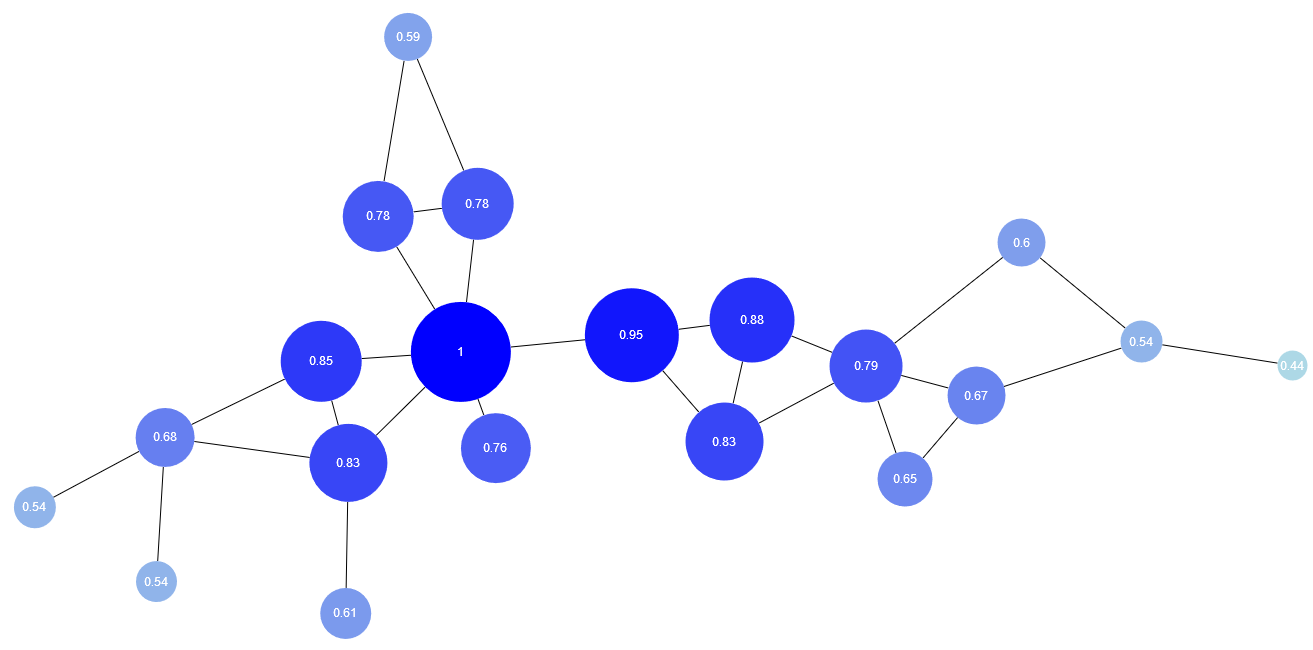
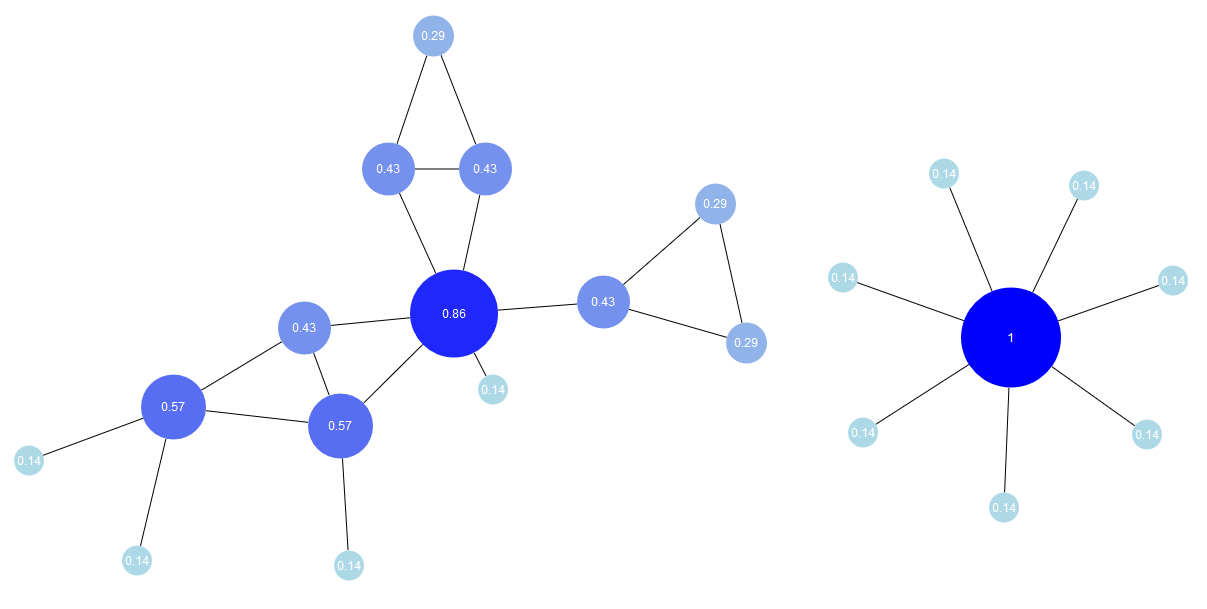
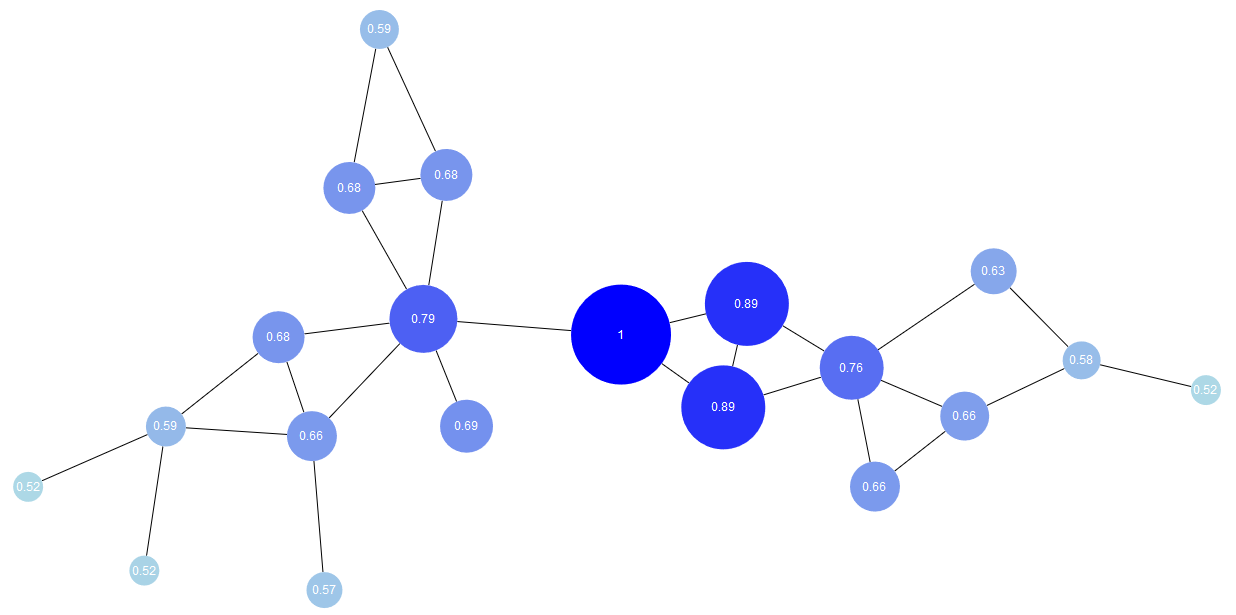
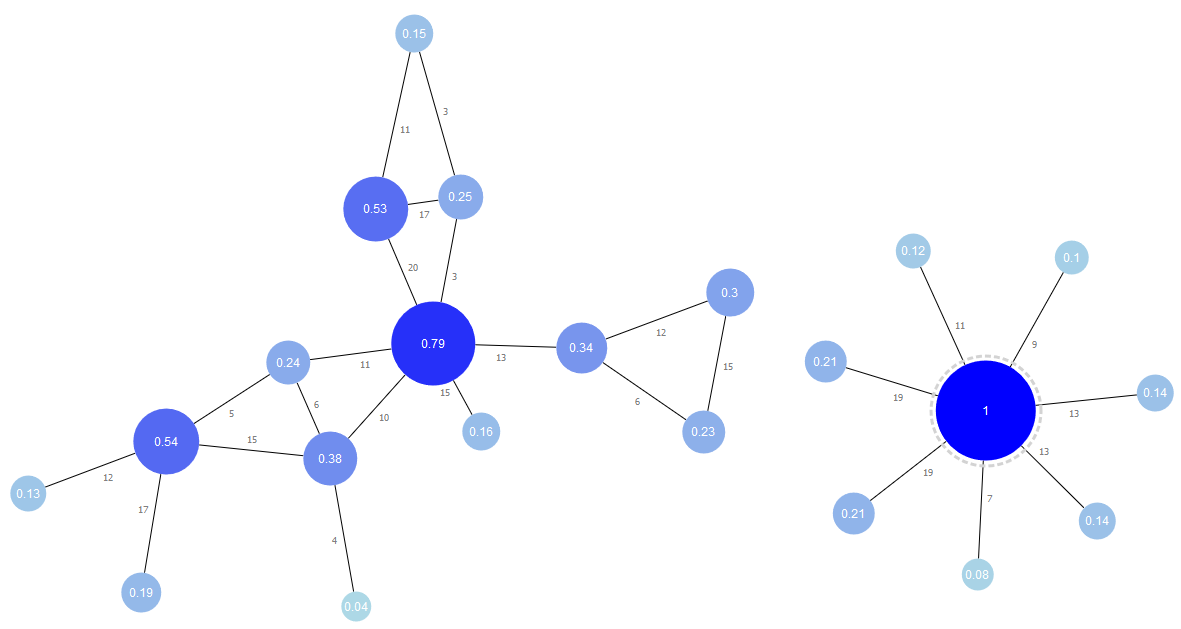
Centrality
For elements within a graph, the importance of a single node or edge can be quantified using centrality measures. The centrality value indicates the element’s importance; a higher value signifies greater importance.
Closeness Centrality
Closeness centrality is the reciprocal of the sum of the shortest path distances from a node to all other nodes in the graph. A node with high closeness centrality is "close" to all other nodes in the graph.
Degree Centrality
Degree centrality is determined by the degree of a node (the number of incoming and outgoing edges).
Graph Centrality
Graph centrality is the reciprocal of the maximum shortest path distance from a node to any other nodes in the graph. Nodes with high graph centrality are "close" to all other nodes in the graph.
Node Edge Betweenness Centrality
Betweenness centrality measures how often a node or edge lies on the shortest path between any two nodes in the graph.
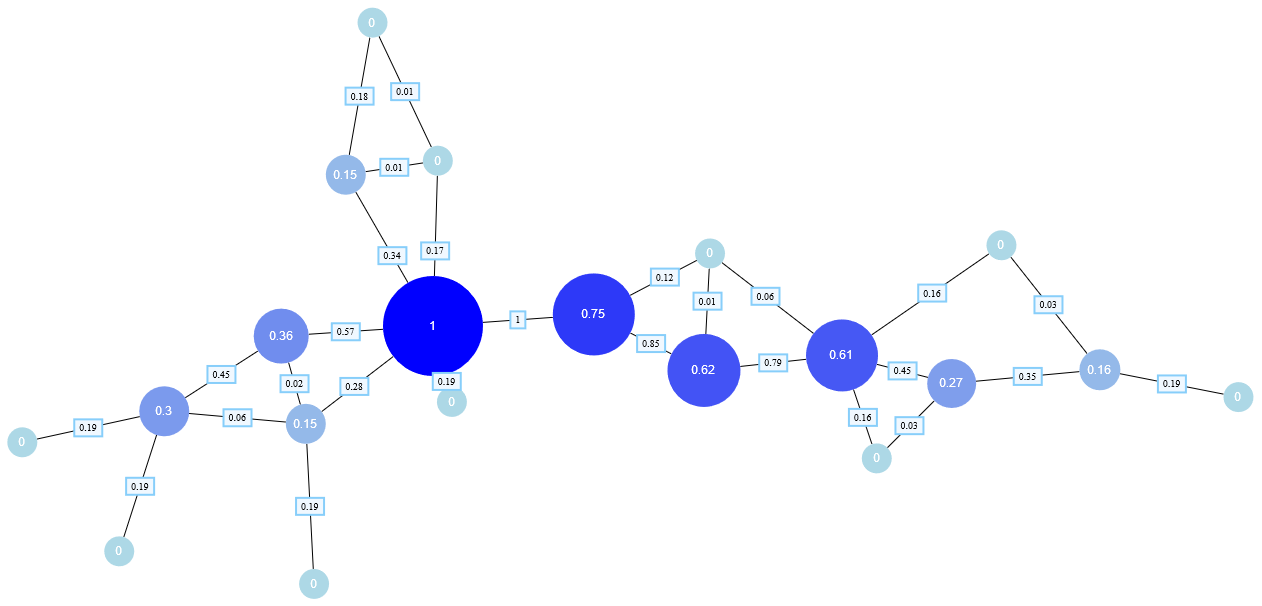
Weight Centrality
Weight centrality measures the weight associated with incoming, outgoing, or all edges of a node. If edges do not have weights, weight centrality is the same as degree centrality.
Chain
A chain contains only nodes with degree 2, plus its start and end nodes.
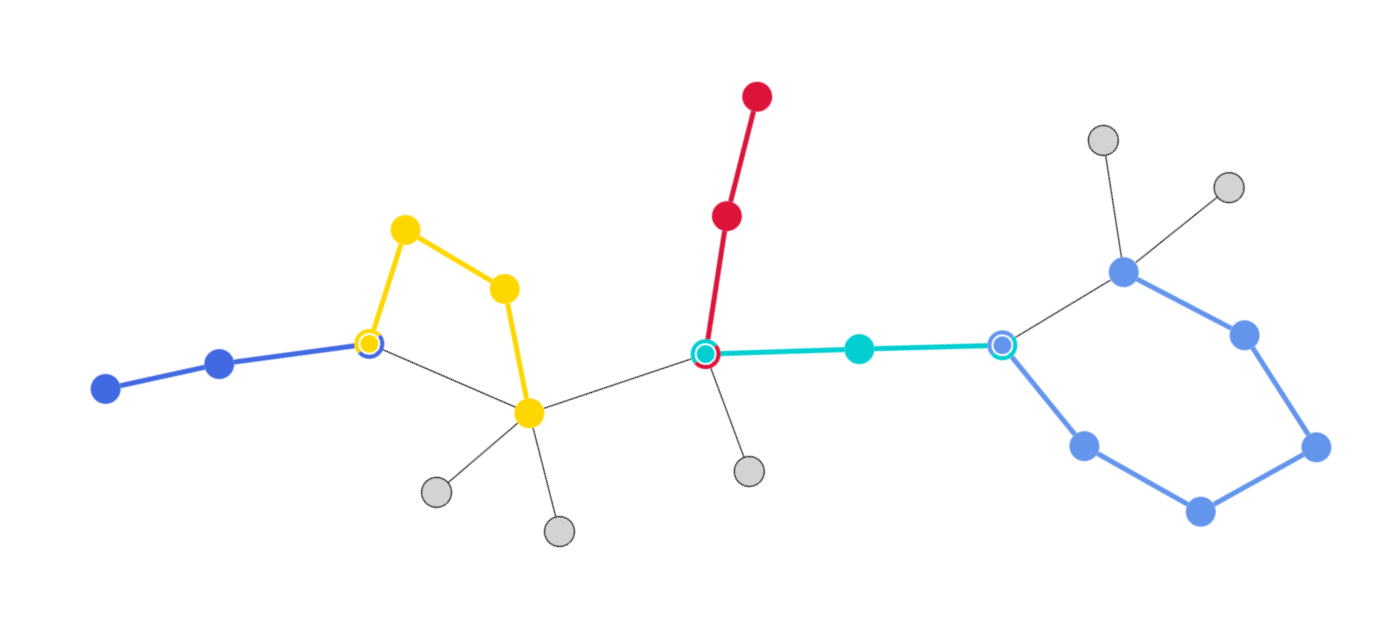
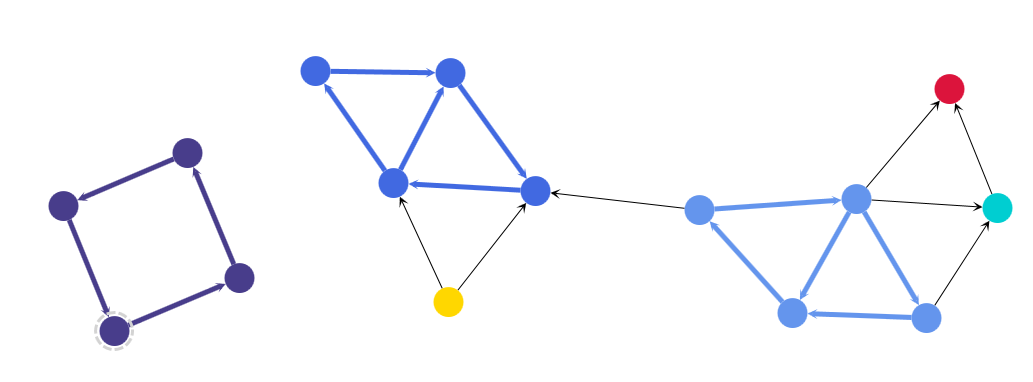
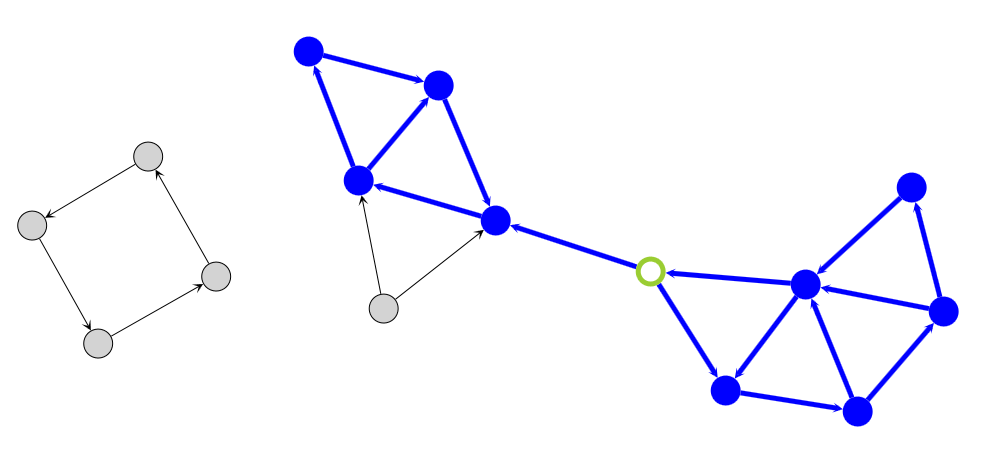
Components
A component is a part of a graph where all nodes are connected to each other.
Components, Connected
Connected components are groups of nodes where all nodes are connected by edges.
Components, Biconnected
A biconnected component is a component that remains connected even after the removal of any single node.
Components, Strongly Connected
A connected component is strongly connected if there is a path between every pair of nodes.
Connected Components
Connected
A graph is called connected if there exists an undirected path of edges between every pair of nodes. See also Components, Connected.
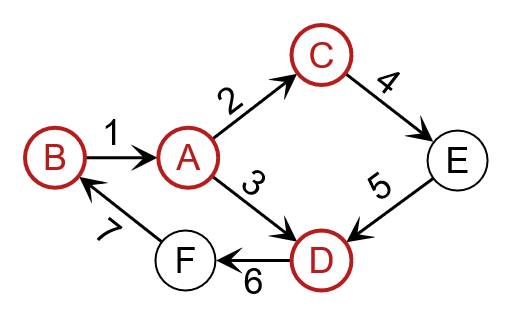
Cycle
A path that starts and ends at the same node.
D
Decision Tree
A decision tree is a visual representation of a series of decisions organized hierarchically. It’s a method for automatically classifying data to help identify the strategy most likely to achieve a specific goal.
Degree
The total number of incoming and outgoing edges connected to a node.
Diagram
A diagram is a graphical representation of data.
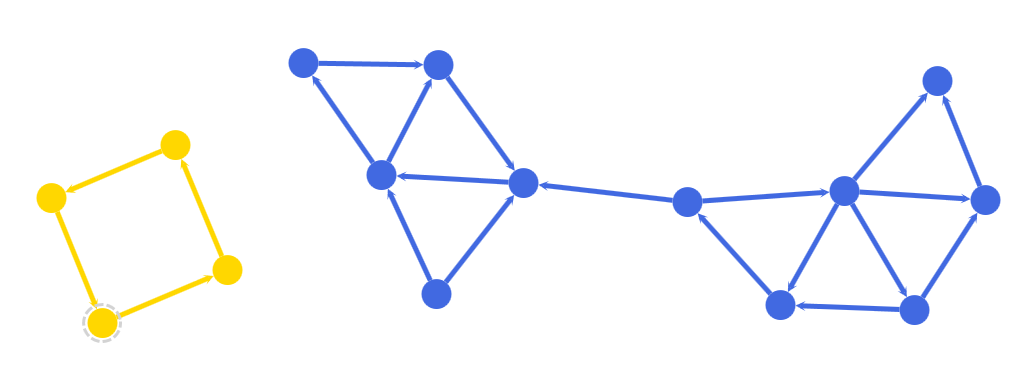
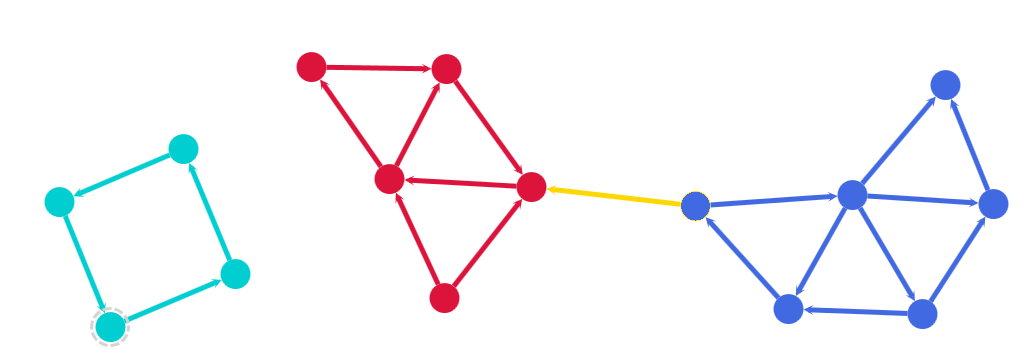
Directed
An edge is considered directed if it has a distinct source node and a distinct target node, indicating a specific direction. A graph is considered directed if all its edges are directed.
E
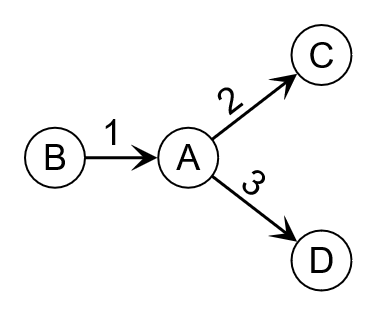
Edge
An edge represents a relationship between two nodes. An edge is usually depicted as a line connecting its end nodes. To indicate the destination of a directed edge, an arrowhead is drawn at the target end of the line.
Depending on the type of diagram, edges may represent different kinds of relationships. This is often reflected in their visual representation, for example, by a special dash pattern or by different colors. It is also common to show extra text information, so-called labels, to provide more information. In directed graphs, the shape and color of the edge’s arrow heads can also provide information about the type of relation.
Depending on the diagram’s type, edges may be drawn as straight lines or lines with bends.
Other names are "arc", "branch", "line", "link", or "relation".
Edge Segment
An edge segment is part of the visual representation of an edge. It connects either a port with a bend, or two bends of the edge. Edges which are drawn as straight lines have only one segment, which connects both ports of the edge.
Edge Routing (Automatic)
A specialized layout algorithm that alters edge paths by placing bends and possibly adjusting the positions of the ports of the edges. The node positions will not be altered by this kind of algorithm. It is often used to straighten edges or route edges around obstacles in diagrams where the node positions are fixed.
Entity Relationship Diagram
A diagram that shows relationships between objects or entities within a system.
F
Family Tree
A family tree (also called a pedigree chart) is a diagram representing family relationships.
Traditionally, family trees were often represented in conventional tree structures. Since a (child) node in a tree can only have one parent node, this approach requires certain restrictions regarding how a family tree can represent the mother and father of an individual. That is, either both parents of an individual share a single node, or the displayed relationships are restricted to matrilineal or patrilineal descent only.
Modern representations for family relationships bypass the restrictions mentioned above by introducing auxiliary nodes for families. That is, the individual nodes for mother and father are predecessor nodes of a family node, while the nodes representing the couple’s children are successor nodes of the family node. Since parents must be born before their children, the resulting structures are directed, acyclic graphs.
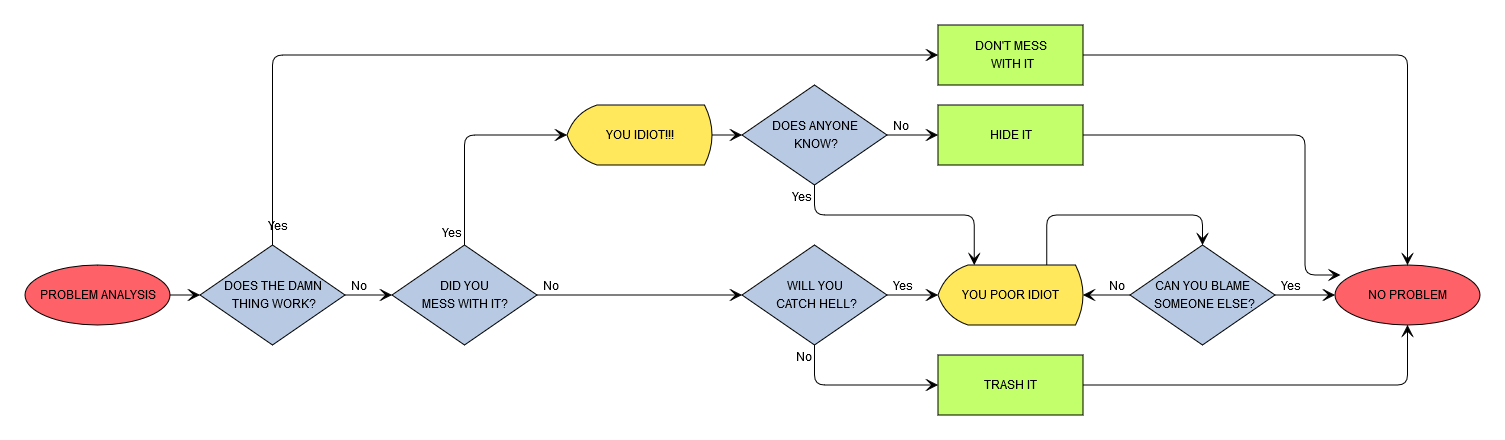
Flowchart
A flowchart is a diagram that visualizes a process or workflow.
Force-Directed Layout
A layout algorithm that applies repulsive forces between nodes and attractive forces along edges. The calculated node positions result from balancing the repulsive and attractive forces.
Another name is organic layout.
Forest
A graph whose connected components are trees.
G
Graph
A graph is a mathematical object that consists of two sets: a node set and an edge set.
Graph, acyclic
An graph that contains no directed cycle.
Graph, directed
A graph is considered directed if all of its edges are directed.
Graph, undirected
A graph is considered undirected if none of its edges has a direction.
Grouped Graph
A graph where nodes can have other nodes as parents. The parent of a node is referred to as a group node. Nodes with a common parent are considered to be in the same group or grouped.
H
Hierarchical Layout
The hierarchical layout style is designed to emphasize the primary direction or flow within a directed graph. The nodes of a graph are arranged in hierarchical layers, positioning most edges to follow a consistent overall orientation, such as top-to-bottom. Furthermore, the nodes are ordered within each layer to minimize edge crossings.
I
Incoming Edge
A directed edge is an incoming edge at its target node.
Indegree
The number of incoming edges at a node.
Inner Node
A node in a tree that has more than one connecting edge, but is not the root node. In particular, in a directed tree an inner node has an arbitrary number of outgoing edges and exactly one incoming edge.
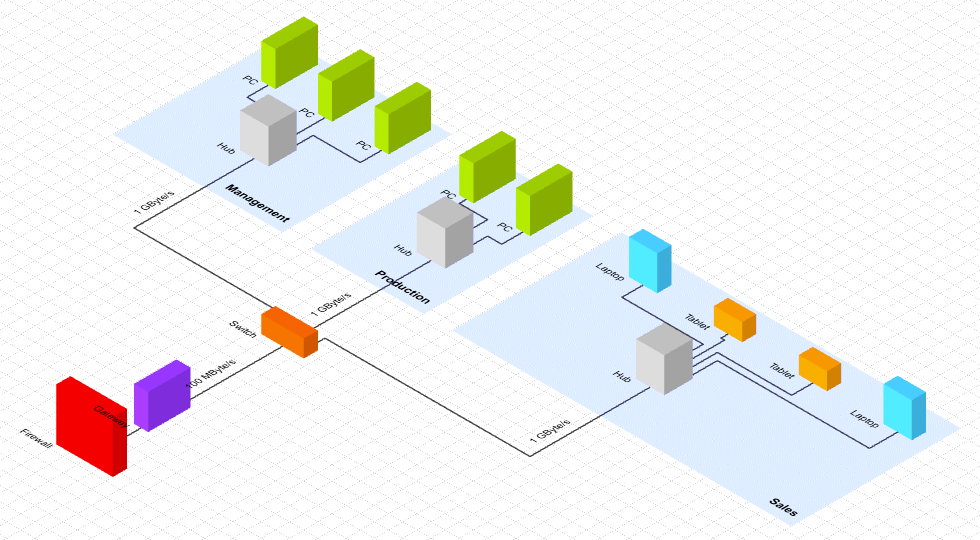
Isometric Projection
Isometric projection is a method of visually representing three-dimensional objects in two dimensions. In this projection, the three principal axes are equally foreshortened, and the angles between them are 120 degrees.
L
Label
A label adds information to a graph element by providing a caption.
Layout
Layout defines the position of objects in space. For graphs, the layout defines the position of nodes and bends in two or three-dimensional space.
In computing, layout is the process of calculating these positions, often considering various constraints. See also layout algorithm.
Layout Algorithm
Algorithms that calculate the positions of nodes and bends (or more general graph elements) in two or three-dimensional space, considering various constraints. Different layout algorithms pursue different goals, like reducing edge crossings and keeping paths as short or straight as possible. Examples include:
-
The hierarchical layout, which emphasizes the flow direction in a directed graph and is often combined with aesthetic aspects like symmetry or reducing the number of edge crossings.
-
The force-directed layout or organic layout applies repulsive forces between nodes and attractive forces along edges.
Leaf Node
A node in a tree that has exactly one connecting edge. In particular, in a directed tree, a leaf node has no outgoing edges and exactly one incoming edge.
Line
Another name for edge.
Link
Another name for edge.
M
Maximum Flow Problem
The maximum flow problem is an optimization problem that involves finding the largest possible flow from a source node to a sink (destination) node through a network of edges. Each edge in the network has a maximum capacity.
Mindmap
A mind map is a diagram that visualizes thoughts and ideas about a topic.
Minimum Cost Flow Problem
The minimum-cost flow problem is an optimization problem to find the least expensive way to send a specific amount of flow through a network that has capacity and cost constraints.
Minimum Spanning Tree
See Spanning Tree.
Multi-Edges
Edges that connect the same two nodes are called multi-edges.
N
Network
See Graph.
Node
A node is a graph item that represents an entity.
O
Organization Chart
An organization chart is a diagram that visualizes the relationships and dependencies between employees, positions, and jobs within an organization.
Outdegree
The number of outgoing edges originating from a node.
Outgoing Edge
A directed edge is considered an outgoing edge at its source node.
P
Parallel Edges
Multi-edges are referred to as parallel edges when they are parallel to each other.
Path
A path is defined by a sequence of edges which connects a sequence of distinct nodes.
Planar
A graph is called planar if it can be drawn on a plane without any edge crossings.
Port
A point where an edge connects (or can connect) to a node.
Ports are used to specify, for example:
-
The exact coordinates (absolute or relative to the node) where an edge connects to a node.
-
Which kinds of edges can connect at this node and at these locations.
-
To add visual representations that provide further information.
Predecessor
The source node of a directed edge that ends at another node is called the predecessor of that node. In other words, the predecessor of a node is the node at the opposite end of an incoming edge to that node.
R
Reachability
Reachability analysis determines which nodes can be reached from a given node by following a path.
Relation
Another name for edge.
Reverse Edge
An edge is considered the reverse of another edge if its source node is the target node of the other edge, and its target node is the source node of the other edge.
Root Node
A distinguished node in a tree that has multiple connecting edge,edges. Specifically, in a directed tree, the root node has any number of outgoing edges and no incoming edge.
Rooted Tree
A directed tree with a designated node as its root.
S
Sankey Diagram
A Sankey diagram is a diagram that visualizes flow information, where the thickness of the edges represents the flow quantity.
Self-loop
An edge where the source and target nodes are the same.
For a directed graph, a self-loop increases both the in-degree and the out-degree by one.
For an undirected graph, a self-loop increases the degree of its adjacent node by two.
Sequence Diagram
A sequence diagram is a diagram that visualizes how different parts of a system interact with each other to perform a specific task, and the order in which they interact.
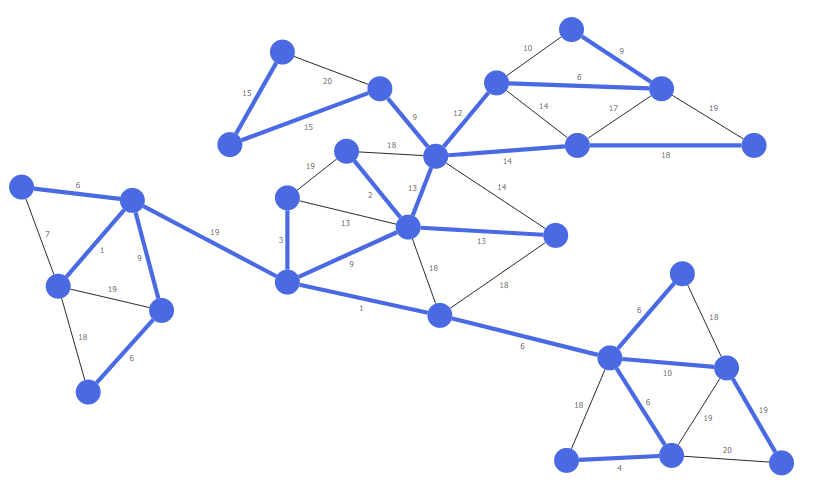
Shortest Path Problem
The problem of finding the path between two nodes where the sum of the weights (costs) of its edges is the smallest possible.
Sibling
In grouped graphs, two nodes are siblings if they have the same parent.
In trees, two nodes are siblings if their incoming edges originate from the same source node.
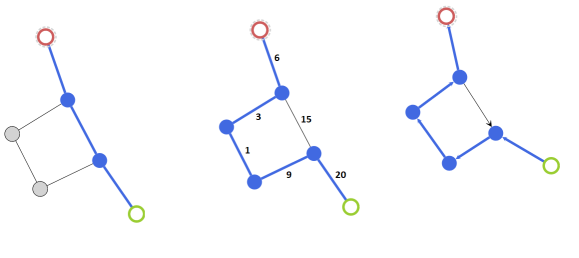
Spanning Tree
A spanning tree of an undirected connected graph is a subset of its edges that forms a tree connecting all nodes of the graph. A minimum spanning tree of a weighted connected graph is a spanning tree with the lowest possible total cost for its edges among all spanning trees of that graph.
Successor
The target node of a directed edge which starts from another node is called the successor of that node. In other words, a node’s successor is the node at the end of an outgoing edge from that node.
Source Node
The node from which a directed edge originates.
Subgraph
A distinguishable part of a graph.
T
Target Node
The destination node of a directed edge.
Tree
A special kind of acyclic graph where all possible pairs of nodes have exactly one path between them. Depending on how trees are drawn, one node may be singled out as the root node.
U
UML
Unified Modeling Language (UML) is a diagramming language used to visualize the structure and behavior of a system and its interactions with users.
Undirected
An edge is undirected if it does not have a direction. That is, there is no distinct source node or target node. A graph is undirected if all its edges are undirected.
V
Vertex
See node.
Y
yEd
yEd is a powerful desktop application that you can use to quickly and effectively generate high-quality diagrams.
yFiles
yFiles are comprehensive class libraries that enable you to add high-quality diagramming functionality to software applications.
yWorks
Tübingen-based company specializing in tools for graph visualization. The company’s notable products are the graph visualization toolkit yFiles for various platforms, as well as the interactive graph editor yEd.