Using Projections
A GraphComponent displays a section of the graph defined by the viewport. By default, this viewport is defined by a combination of translation (the viewPoint) and scaling (the zoom).
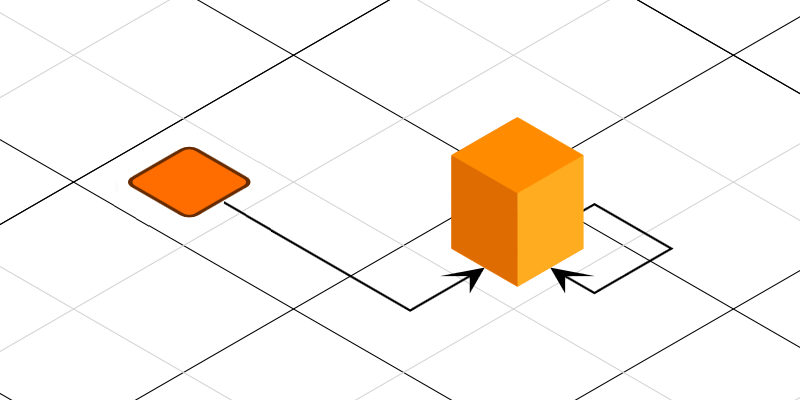
In addition, you can set an affine transformation that is applied to the rendering of the GraphComponent. Typically, this is used for visually representing graph elements as three-dimensional objects, for example, in isometric renderings. Using projections is compatible with most other functionality of yFiles for HTML, such as user interaction (including orthogonal edge editing and snapping) or layout calculation.
After setting a projection, graph elements will appear to be projected onto the resulting plane. To use this feature in combination with a custom style, see the Isometric Drawing demo on how to render nodes to appear three-dimensional.
The additional transformation is set as the CanvasComponent.projection property, for example, to the predefined Matrix.ISOMETRIC projection.
// Setting the projection to one of the standard projections
graphComponent.projection = Matrix.ISOMETRICThe projection can be removed by setting it to IDENTITY:
// Resetting the projection
graphComponent.projection = Matrix.IDENTITYYou can also set a custom projection:
// Setting a custom projection
const projection = new Matrix()
projection.scale(1, 0.577)
projection.rotate(Math.PI / 4)
graphComponent.projection = projectionUnderstanding Projections
yFiles for HTML uses three distinct coordinate systems.
- World coordinate system
-
This is the coordinate system in which the position and size of graph objects are specified.
- Intermediate coordinate system
-
This is the coordinate system in which the view point and zoom have been applied. This coordinate system is useful for drawing decorations independent of zoom level. Selection and highlight decorations are drawn in this coordinate system, for example.
- View coordinate system
-
This is the coordinate system in which view point, zoom, and projection have been applied. The point (0,0) in this coordinate system lies in the upper left corner of the control and lengths correspond to distances in pixels on the screen. Typically, a watermark or legend would be drawn in this coordinate system.
|
Important
|
By default, the projection is set to IDENTITY, so the intermediate and view coordinate systems are identical. Once a different projection has been set, this is no longer the case. |
To transform a point between these coordinate systems, the following methods are available:
-
CanvasComponent.worldToIntermediateCoordinates(worldPoint: Point): Point
-
CanvasComponent.intermediateToViewCoordinates(intermediatePoint: Point): Point
-
CanvasComponent.viewToIntermediateCoordinates(viewPoint: Point): Point
-
CanvasComponent.intermediateToWorldCoordinates(intermediatePoint: Point): Point
|
Tip
|
To transform directly from world to view coordinates and vice versa, use the more common viewToWorldCoordinates(Point) and worldToViewCoordinates(Point) on CanvasComponent, as described in Managing the View. |
In addition, the transformation matrices and a subset of the above transformation methods are also available on the IRenderContext instances. When implementing visualizations, the methods on IRenderContext must be used, if possible.
Drawing Elements in World Coordinates
Drawing in world coordinates is the default behavior and requires no further setup. See Basic Style Implementation for a general introduction to drawing with yFiles for HTML.
Drawing Elements in Intermediate Coordinates
Drawing in intermediate coordinates can be useful to render visualizations that must be zoom-independent. A common example of this kind of drawing is handles. Handles are anchored to a location in the world coordinate system (for example, a bend on an edge or a corner of a node), but zooming does not change their size. yFiles for HTML handles this internally. However, it is also possible to draw arbitrary visuals independent of the zoom level.
In the following example, a line is drawn with constant thickness, independent of the current zoom level:
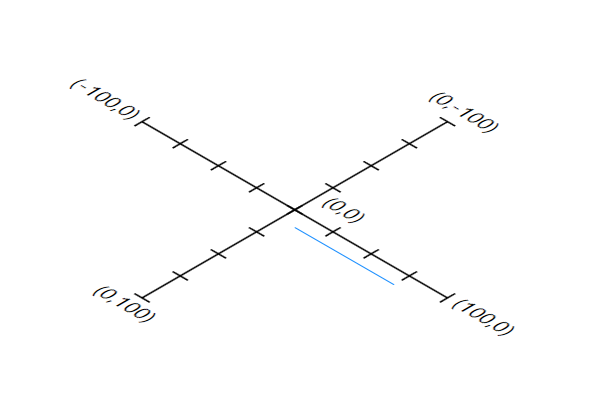
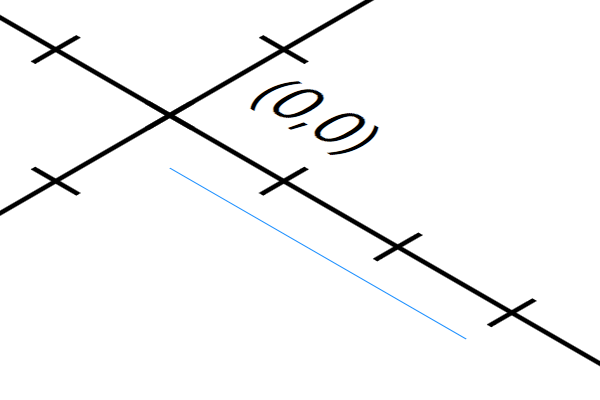
Note that the start and end points are transformed into the correct coordinate system. Without this conversion, the line would move when the viewport is moved because the intermediate coordinate system already includes the viewport transformation.
createVisual(context: IRenderContext): SvgVisualGroup {
  // create a visual group
  const zoomIndependentGroup = new SvgVisualGroup()
  // configure the visual group to be rendered in intermediate coordinates
  zoomIndependentGroup.transform = context.intermediateTransform

  // create a line from world point (20,20) to world point (75,20)
  // since the group is rendered in intermediate coordinates,
  // start and end of the line have to be transformed
  const start = context.canvasComponent!.worldToIntermediateCoordinates(
    new Point(20, 20)
  )
  const end = context.canvasComponent!.worldToIntermediateCoordinates(
    new Point(75, 20)
  )
  const line = document.createElementNS(
    'http://www.w3.org/2000/svg',
    'line'
  )
  line.x1.baseVal.value = start.x
  line.y1.baseVal.value = start.y
  line.x2.baseVal.value = end.x
  line.y2.baseVal.value = end.y
  Stroke.setStroke(Stroke.DODGER_BLUE, line, context)
  zoomIndependentGroup.add(new SvgVisual(line))
  return zoomIndependentGroup
}Drawing Elements in View Coordinates
Drawing Custom Visuals in View Coordinates describes rendering arbitrary visualizations in view coordinates. However, there are already several default user interface visuals that can be configured to be drawn in view or intermediate coordinates:
Marquee Rectangle
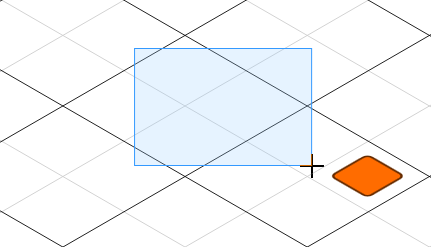
Drawing the marquee rectangle in view coordinates is what users typically expect. However, it can be beneficial to use intermediate coordinates, for example, when selecting rows in a hierarchically laid out graph. Use the useViewCoordinates property to switch between the two behaviors.
// gim is a GraphEditorInputMode or GraphViewerInputMode
gim.marqueeSelectionInputMode.useViewCoordinates = false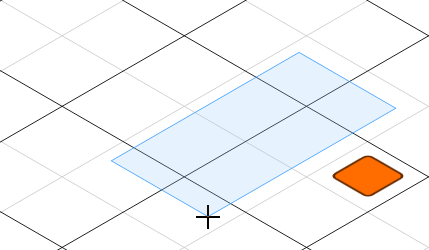
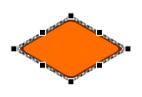
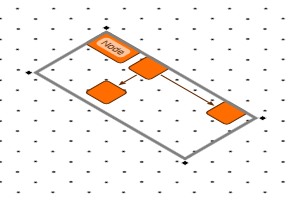
Handles
Handles are, by default, drawn in intermediate coordinates. This makes them appear to reside in the same plane as the graph elements. They can also be drawn in view coordinates using the HandleInputMode.useViewCoordinates property. This is useful for projections that include more extreme scaling factors, which can make handles hard to see.
// geim is a GraphEditorInputMode
geim.handleInputMode.useViewCoordinates = true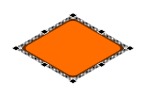
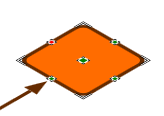
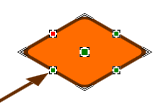
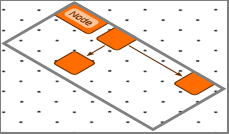
Port Candidates
When using the PortCandidateRenderer for the port candidates, you can adjust the useViewCoordinates property.
// geim is a GraphEditorInputMode
const portCandidateRenderer = new PortCandidateRenderer()
portCandidateRenderer.useViewCoordinates = true
geim.createEdgeInputMode.portCandidateRenderer = portCandidateRendererThe coordinates used for port candidates can be either intermediate or view coordinates:
Drawing Custom Visuals in View Coordinates
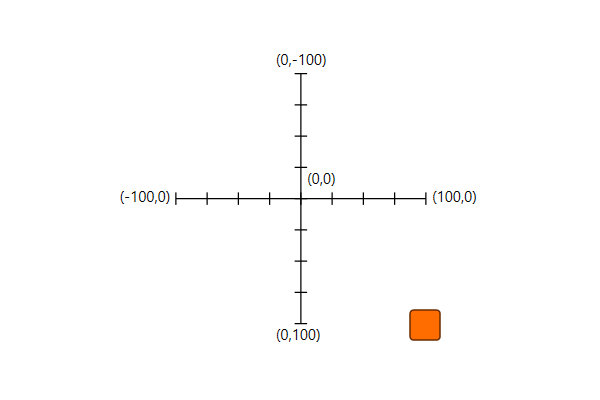
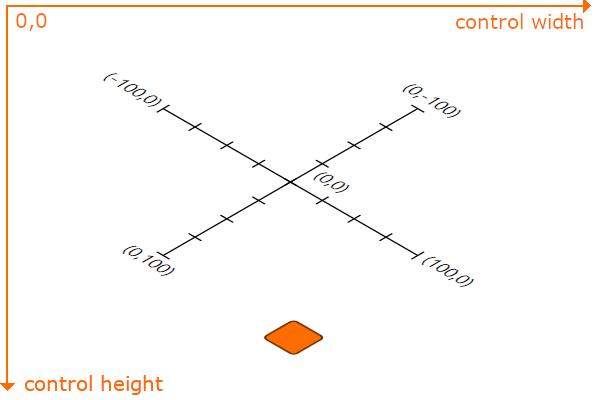
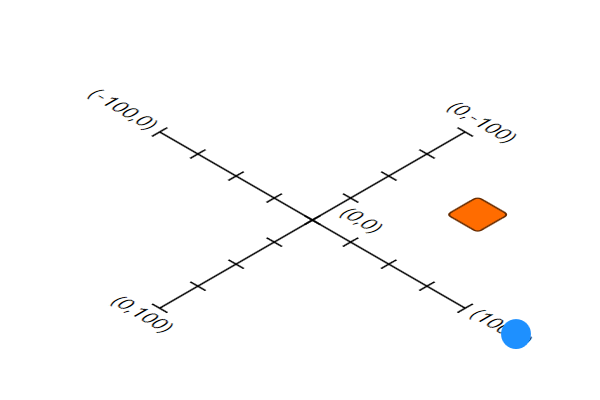
Arbitrary visuals can also be drawn onto the GraphComponent in view coordinates. Setting the viewTransform as SvgVisualGroup.transform will cause the visual to be drawn as if hovering above the Control, similar to a watermark. In this coordinate system, the point (0,0) is the upper left corner and (width,height) is the lower right corner. Note that the circle itself is unaffected by the transform; it is not deformed by the projection.
createVisual(context: IRenderContext): SvgVisualGroup {
  const viewGroup = new SvgVisualGroup()
  // set the VisualGroup's transform to ViewCoordinates
  viewGroup.transform = context.viewTransform

  // create a circle and set its position to the lower right of the control
  const circle = document.createElementNS(
    'http://www.w3.org/2000/svg',
    'circle'
  )
  Fill.setFill(Color.DODGER_BLUE, circle, context)
  const position = new Point(
    context.canvasComponent!.size.width - 20,
    context.canvasComponent!.size.height - 20
  )
  circle.cx.baseVal.value = position.x
  circle.cy.baseVal.value = position.x
  circle.r.baseVal.value = 20
  viewGroup.add(new SvgVisual(circle))
  return viewGroup
}
Interacting with Projected Graphs
Since the standard events use world coordinates, they generally "just work." However, depending on the projection used, there are some considerations to keep in mind.
Keyboard Navigation
Shift ⇧+arrow keys and Ctrl+arrow keys focus and select a node in the respective direction. The node that is considered the next node in this direction can be determined either in world coordinates (default) or in view coordinates. For example, if the projection horizontally mirrors the graph, keyboard navigation would appear to be horizontally inverted in world coordinates.
// gim is a GraphEditorInputMode or GraphViewerInputMode
// set keyboard navigation to consider where nodes appear on screen instead of
// what their location in world coordinates is
gim.navigationInputMode.useViewCoordinates = true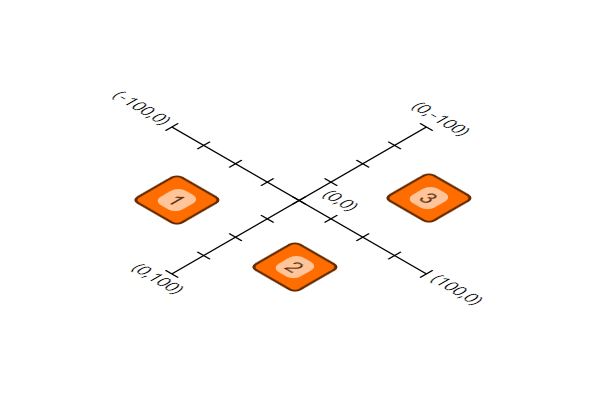
2 is to the right of node 1. In view coordinates, node 3 is to the right.Scrollbars and Content Fitting
Without a projection, the contentBounds property, a rectangle in world coordinates, determines scrollbar behavior. It’s also used for adjusting the viewport with fitContent and fitGraphBounds. When a projection is enabled, the scrollable area is automatically computed from all visible graph elements in view coordinates and cannot be set manually.
fitContent adjusts the viewport to enclose the bounding box of the contentBounds property. This area might be significantly larger than the graph, depending on how the projection transforms it. Any contentMargins property will be applied to this bounding box. To fit the graph tightly to the visible area, use fitGraphBounds instead.
|
Note
|
Updates to the scrollable area are triggered whenever the content bounds are updated, such as when graph elements are added interactively. When adding or removing elements programmatically, you must call updateContentBounds to update the scrollable area as well. |
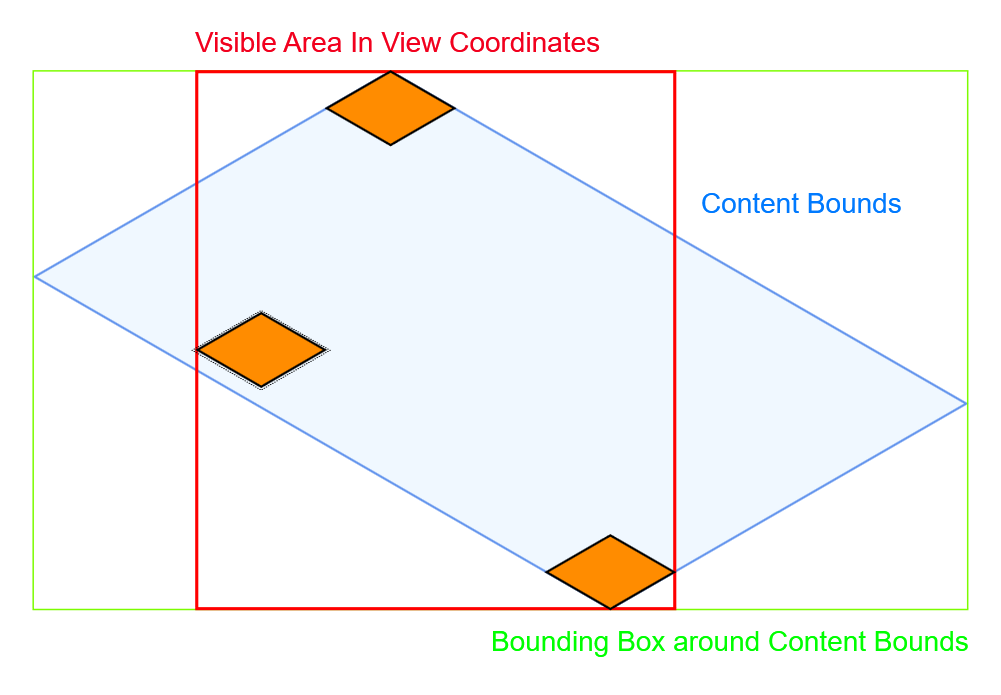
Image Export
Image export works as described in section Image Export. However, when a projection is set, the worldBounds rectangle is no longer parallel to the image’s coordinate system axes. In this case, a bounding rectangle is chosen to completely encompass the worldBounds, ensuring that the entire content is visible. However, this approach might create large areas of unnecessary whitespace.
An axis-parallel rectangle in view coordinates is not a rectangle in world coordinates. Instead, it is a polygon whose points can be set by worldPoints. The following example demonstrates how the marquee rectangle can be computed to set the world points:
// Create a new marquee input mode (despite the name it will only
// allow to drag a marquee, not select anything)
const marqueeMode = new MarqueeSelectionInputMode({
  // Ensure that the marquee is rectangular in view coordinates
  useViewCoordinates: true
})
// Add to the GraphEditorInputMode instance
graphEditorInputMode.add(marqueeMode)

marqueeMode.addEventListener('drag-finished', async (evt) => {
  // Collect the corner points of the rectangle in world coordinates
  const points: Point[] = []
  for (const cursor = evt.path.createCursor(); cursor.moveNext(); ) {
    if (cursor.pathType != PathType.CLOSE) {
      points.push(cursor.currentEndPoint)
    }
  }

  // Pass the points along with the correct projection to the SVG Export
  // worldBounds is just a dummy rectangle that's overwritten
  // by the following worldPoints anyway
  const svgExport = new SvgExport({
    worldBounds: Rect.EMPTY,
    worldPoints: points,
    projection: graphComponent.projection
  })

  // Export the image
  const svg = await svgExport.exportSvgAsync(graphComponent)
  downloadFile(SvgExport.exportSvgString(svg), 'image.svg')
})
Printing
Printing works as described in section Printing. However, when a projection is set, the print rectangle is no longer axis-aligned to the image’s coordinate system. In this case, a bounding rectangle is chosen to completely encompass the print rectangle so that all of the content is guaranteed to be visible. However, this may create large portions of unnecessary whitespace.
An axis-aligned rectangle in view coordinates is no longer a rectangle in world coordinates. Instead, it is a polygon whose points can be set by world points. The following example shows how the smallest possible bounds around the contents can be computed to set the world points:
// start with an empty rectangle as bounds
let bounds = Rect.EMPTY

// transform the coordinates into a coordinate system
// which is axis-parallel to the printing paper
const matrix = graphComponent.projection.clone()

const contentGroupElements = graphComponent.renderTree.getElements(
  graphComponent.renderTree.contentGroup
)
for (const renderTreeElement of contentGroupElements) {
  // for each render tree element get the bounds
  const b = renderTreeElement.renderer
    .getBoundsProvider(renderTreeElement.tag)
    .getBounds(graphComponent.canvasContext)
  if (b.isFinite) {
    // transform all corners into projected coordinates
    // and add to the bounds
    bounds = bounds.add(matrix.transform(b.topLeft))
    bounds = bounds.add(matrix.transform(b.topRight))
    bounds = bounds.add(matrix.transform(b.bottomLeft))
    bounds = bounds.add(matrix.transform(b.bottomRight))
  }
}
// now bounds is the smallest rectangle which encloses all objects
// and which is axis parallel to the paper
matrix.invert()
// now transform the corners of the bounds back into the world coordinate system
const points = [
  matrix.transform(bounds.topLeft),
  matrix.transform(bounds.topRight),
  matrix.transform(bounds.bottomRight),
  matrix.transform(bounds.bottomLeft)
]

const printSupport = new PrintingSupport()
printSupport.print(graphComponent, points)Note that the PrintingSupport class used in the Printing demo already uses the smallest possible area of the canvas.
Unsupported Functionality
-
Manually setting the contentBounds property.