Storing Business Data for Graph Elements
It is a common task to connect graph items with the data model they represent, also known as business data. For this use case, all model items provide a user tag property. This property is readable and writable and can hold arbitrary objects.
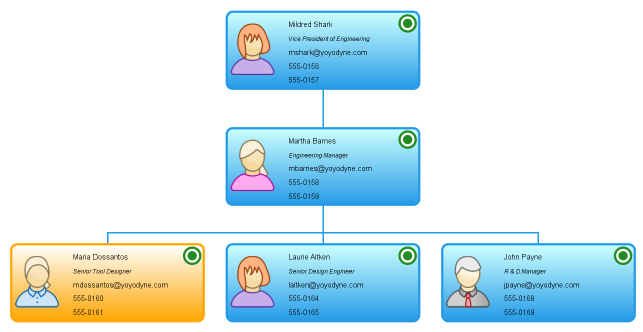
In an organization chart, for example, nodes represent employees, and edges represent the relationships between them. You can assign the business data for an employee to the tag of the node instance that represents that employee in the graph. Similarly, you can store information about the relationship between two employees in the tag of the edge that connects the nodes representing these employees.
// creating a new node with an initial tag
node = graph.createNode(
  new Rect(0, 0, 30, 30),
  new ShapeNodeStyle(),
  new Employee('Mildred', 'Shark')
)

// alternative using options
node = graph.createNode({ tag: new Employee('Mildred', 'Spark') })

// setting the user tag to an existing node
node.tag = new Employee('Marta', 'Barnes')

// retrieving the user tag
if (node.tag instanceof Employee) {
  const employee = node.tag
  console.log(employee.firstName + ', ' + employee.lastName)
}Note that you can also set user tags when you create the item. All create methods, for example, createNode(layout: Rect, style: INodeStyle, tag: Object) for nodes, have an overload that allows you to set the initial user tag. Setting user tags at creation time is preferred to avoid unnecessary changes.
Setting the user tag after creation dispatches a TagChanged event for the corresponding item. For changes to node tags, a listener can be registered with node-tag-changed, for example.
The Organization Chart demo shows how to create a graph based on business data, how to store the data in the user tags of graph elements, and how to create visual representations that use the data stored in the user tags for visualization.