Visualization of Graph Elements: Styles
The visual appearance of graph elements in yFiles for HTML is determined by styles.
Before the GraphComponent can display an object on the canvas, it needs to know how the object should look. For graph items, styles manage creating the visual appearance and updating the appearance when the underlying data model changes. Each type of graph element (except for bends) has a corresponding style interface. For example, the style interface for nodes is INodeStyle.
Even though a style is a property of the model item, the model remains independent of the visualization. For example, the same graph model can be visualized using completely different styles without affecting the model.
|
Tip
|
As with all model item properties, the graph that contains the items is responsible for managing those items. This means that the properties of the items are read-only and can only be set via the graph instance. |
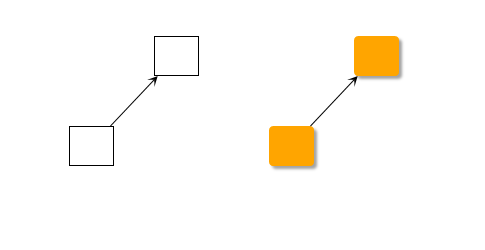
// create a node with a given style
const node1 = graph.createNode(
  [0, 0, 40, 40],
  new ShapeNodeStyle({
    shape: 'rectangle',
    fill: 'white',
    stroke: 'black'
  })
)

// set a style to a given node
graph.setStyle(
  node2,
  new RectangleNodeStyle({
    fill: 'orange',
    stroke: 'darkgoldenrod',
    cornerSize: 5,
    cornerStyle: 'round'
  })
)

// same for edges: create an edge with a given style
graph.createEdge(
  node1,
  node2,
  new PolylineEdgeStyle({ targetArrow: 'stealth' })
)
// set a style to a given edge
graph.setStyle(edge2, new BezierEdgeStyle())During visualization, the style receives the item for which the visual appearance is to be created, the bounds within which the visualization should be painted, and other contextual information. The style does not retain any information about the item itself. Therefore, style instances are generally meant to be shareable among various items.
|
Tip
|
The graph has default style settings that are applied when items are created without a specific style being assigned. In the default configuration, this default style is a single instance that is shared among all items created in this manner. |
Sharing styles improves memory usage. However, any change to a property of a shared style is immediately reflected in all items that share that style.
yFiles for HTML provides a wide array of predefined styles for all styleable graph elements that can be used out-of-the-box. Some of the most common node styles are the ShapeNodeStyle for basic geometric shapes and the GroupNodeStyle for group nodes.
Only graph elements have associated styles. Other elements in the view (for example, selection markers or handles) are visualized using a different mechanism, as described in the section Styling Selection, Focus, and Highlight.
|
Note
|
Bends do not have an associated style interface because they are visualized as part of the edge visualization (if at all). |
The common interfaces for styles are intentionally small. Each style implementation has its own set of properties to configure the resulting visual appearance (for example, the colors).