Tables and Swimlanes
Partitioned layouts, tabular layouts, and, in particular, the special case of swimlane layouts, are supported by the LayoutGrid class.
This class specifies a grid that consists of rows and columns, and the grid cells that result from the rows and columns. Each node can be assigned to a single cell or a set of consecutive grid cells and will stay in these cells during layout. In addition to the structure, the class stores geometric information about rows and columns, for example, a row holds the height, minimumHeight, and position.
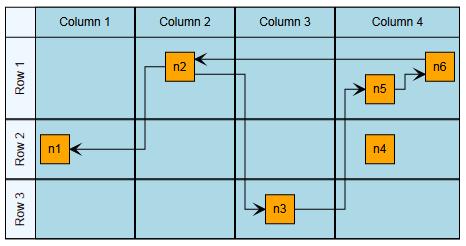
The layout of a table shows a tabular layout. Note the layout grid cells that result from the rows and columns.
The following layout and edge routing styles support a defined LayoutGrid:
-
Tabular Layout (only nodes, only a single node per cell)
Furthermore, the layout stage GenericLayoutGridStage offers generic support for grid structures. To configure the partition grid for the stage, use its layout data that is created using method createLayoutData.
|
Note
|
If an IGraph contains tables, applying a layout automatically creates a corresponding layout graph model with tabular information. Ultimately, this setup is done by the TableLayoutConfigurator class which creates a LayoutGrid of the Table. LayoutExecutor provides access to its TableLayoutConfigurator instance for advanced configuration and customization. |
private populateAndLayoutTable(
  graphComponent: GraphComponent,
  table: ITable
): void {
  const graph = graphComponent.graph

  // create a top-level group node and bind the table to it
  const parent = graph.createGroupNode(
    null,
    new Rect(0, 0, 10, 10),
    new TableNodeStyle(table)
  )

  // create some rows and columns
  const row1 = table.createRow()
  const row2 = table.createRow()
  const row3 = table.createRow()
  const column1 = table.createColumn()
  const column2 = table.createColumn()
  const column3 = table.createColumn()
  const column4 = table.createColumn()

  // populate some of the cells with nodes
  const n1 = this.createNodeInCell(graph, parent, row2, column1)
  const n2 = this.createNodeInCell(graph, parent, row1, column2)
  const n3 = this.createNodeInCell(graph, parent, row3, column3)
  const n4 = this.createNodeInCell(graph, parent, row2, column4)
  const n5 = this.createNodeInCell(graph, parent, row1, column4)
  const n6 = this.createNodeInCell(graph, parent, row1, column4)

  // connect them with some edges
  graph.createEdge(n2, n1)
  graph.createEdge(n2, n3)
  graph.createEdge(n3, n5)
  graph.createEdge(n5, n6)
  graph.createEdge(n6, n2)

  // create a layout algorithm that supports tables (i.e., layout grid)
  const hierarchicalLayout = new HierarchicalLayout()
  hierarchicalLayout.layoutOrientation = 'left-to-right'

  // and apply it to the graph
  graphComponent.applyLayoutAnimated(hierarchicalLayout, '1s')
}

// Create a node in the center of the given cell.
private createNodeInCell(
  graph: IGraph,
  parent: INode,
  row: IRow,
  column: IColumn
): INode {
  const node = graph.createNode(parent)
  graph.setNodeCenter(
    node,
    new Point(column.layout.center.x, row.layout.center.y)
  )
  return node
}
The Table Editor shows in detail how to create and automatically lay out tables.