Development Mode
The yFiles for HTML library comes with a development mode that makes your development process more efficient, simplifies debugging sessions, and helps you to better understand the yFiles API in general. In development mode, the library contains the type information for all yFiles for HTML types, their members, the parameters of all methods, etc, and other auxiliary functions.
It is highly recommended running yFiles in development mode during development, so you can benefit from meaningful error messages and use the runtime debugging tools that are only present in development mode.However, note that the development mode library is not redistributable and must not be published as-is. Also, the runtime debugging support adds a performance penalty with each method call. See the deployment section for details on preparing the yFiles for HTML library for deployment.
For switching to production mode temporarily, you can enable it manually by including this simple snippet in your HTML file before loading yFiles:
<script>
  window.process = { env: { NODE_ENV: 'production' } }
</script>
Setup
The development mode library is placed in the lib-dev folder next to the lib folder. Inside, you will find the same library variants as in the
regular lib folder, except these will have a development mode that is enabled by default. In development mode, the
runtime type checks and graph inspection tools (that were provided by the yfiles-typeinfo.js
file in previous versions) are enabled. Otherwise, the files in lib and lib-dev are identical.
To check whether the yFiles for HTML library is running in development mode, check the browser’s console for a corresponding log message.
Type Checking
In development mode, the following tests are enabled with each method call and each invocation of a constructor or property:
- proper number of arguments?
- any argument undefined?
- proper types of arguments?
- explicit constructor implementation calls a base class constructor?
The following tests are enabled when a class or interface is actually used the first time:
- class extends an interface instead of implementing it
- class implements an actual class instead of extending it
- class overrides a method or property that is not meant to be overridden
- cyclic class or interface inheritance
Note that these tests will increase the runtime of your application.
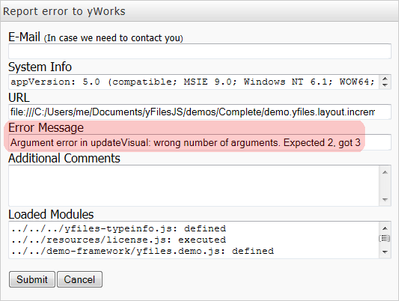
By default, type checking is configured to instantly throw a genuine JavaScript error for any found problem. This avoids any delayed failures of your application, which, in JavaScript, can happen literally anywhere.
In demos that use the yFiles demo framework, these errors are typically shown in an error dialog like this:
Graph Inspection and Status Information
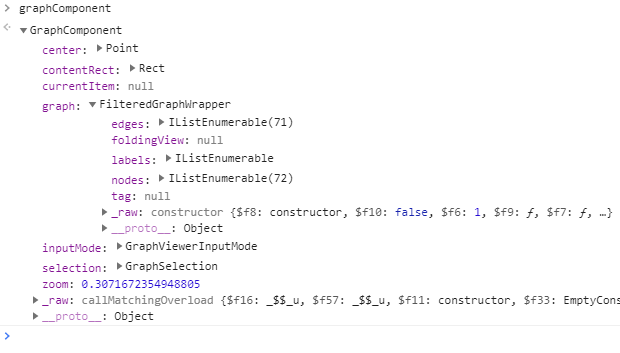
A common task during development and debugging is the inspection and modification of the graph and the graph component from the JavaScript console of the browser. This can be useful, for example, to check the number of nodes and edges in the graph or to experiment with different settings for the user interaction.
The global function yfilesDebug() simplifies this task. It sets the properties window.gc and window.g to a graph component
and its graph, respectively, and makes the last clicked item available in window.gc.clickedItem if possible.
Additionally, it makes yfiles accessible from the global scope (e.g. window.yfiles),
shows details about the yFiles for HTML version and the license, and disables catchErrors in the yFiles
error handling. Without the yFiles error handling, most errors become uncaught errors and are easier to debug in
the JavaScript debugger of the browser.
Its syntax is as follows:
function yfilesDebug(id? : string | Element) {}The optional parameter id identifies the graph component. If it is a string, the graph component is looked up
with the methods document.getElementById(id) and document.querySelector(id).
If it is undefined, the element with the id "graphComponent" is used instead, if available.
If the parameter is an element, the DOM hierarchy is traversed from this element on upwards in order to locate the graph
component. This is especially useful in conjunction with the variable $0 that is available in the debugging
tools of some browsers.
Note that the clickedItem is only available if the input mode of the graph component supports adding
a clicked listener.
Custom Formatters
Starting with version 2.3, the development mode library of yFiles for HTML supports custom formatting of yFiles objects in the browser’s JavaScript debugger. With custom formatters, objects are displayed in a nice, easily understandable way when inspected in the debugger.
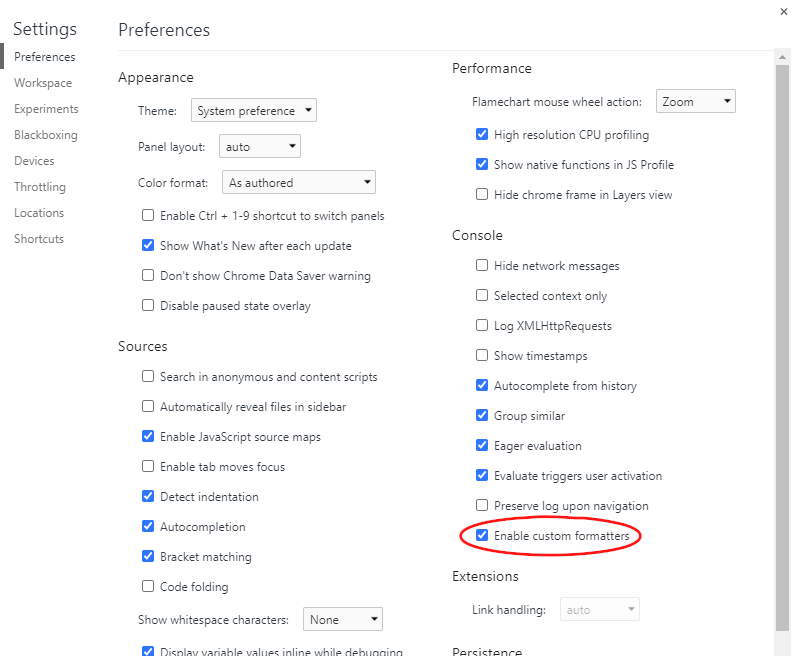
At the time of writing, custom formatters are supported by Chromium-based browsers, most notably by Google Chrome and Microsoft Edge, and Mozilla Firefox. In all these browsers, one must manually enable custom formatters via the settings of the developer tools (F1).