Large Graph Performance
This section covers techniques for displaying and editing very large graphs with thousands of elements with yFiles for HTML. There is an accompanying demo for this topic, the Rendering Optimizations demo, which demonstrates many of the techniques below. The source code for the examples in this section is taken from that demo.
General Considerations
Some of the techniques outlined below vary in their effectiveness depending on the graph structure, its layout, and how users are going to interact with the graph (if at all). For example, performance characteristics of a very spacious balloon layout are different from a very dense hierarchical layout, simply because when zooming in there will be far fewer elements remaining in the viewport for the former.
Testing with the actual graph and adapting parameters or solutions accordingly is often required to achieve good performance. The suggestions and techniques below address actual bottlenecks. In addition, the use of a profiler is highly recommended to find performance problems and fix them accordingly.
Graph Size
Without dedicated optimization techniques yFiles for HTML usually handles graphs up to a few hundred elements just fine. Large graphs in this section refers to graphs with thousands and tens of thousands of elements.
Before thinking about performance optimizations for such large graphs one should consider whether it is strictly necessary to put all elements into a graph at the same time. The sheer number of potential elements in some use cases can often be handled with other methods, e.g. folding parts of the graph that are currently not the focus of attention, or even rendering parts of large graphs to bitmaps and displaying those instead of each and every node.
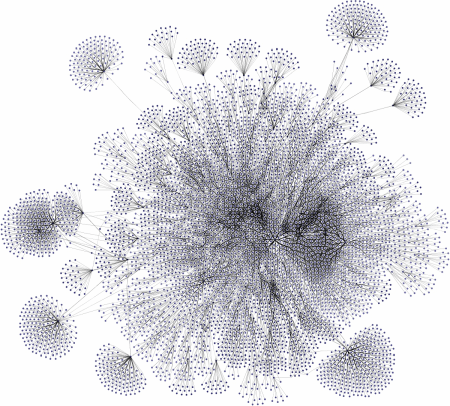
Another consideration is usability: Depending on the layout and the information displayed, reading graphs of large size can be quite hard. Displaying all that data at the same time often leads to visual clutter, and a typical “hairball” graph that might look impressive but does not provide much insight to the viewer. Trimming the graph to its essential parts often improves both usability and performance.
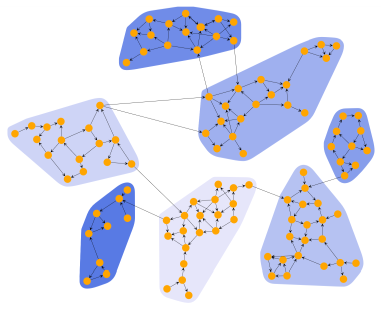
There are several approaches to reduce the complexity of a graph, for example, grouping elements with common properties together, analyzing the data for clusters, or showing or hiding subtrees of a tree structure. The node aggregation algorithmn automatically clusters the nodes of a given graph and creates a hierarchical clustering structure subject to user-specified constraints.
Some of these techniques — often referred to as “Drill Down”, “Expand/Collapse”, “Filtering”, or “Folding” functionality — are shown in the demo applications Hierarchic Nesting, Collapsible Trees, and Organization Chart.
The focus of this section, however, is on techniques that can be used for displaying such large graphs in cases where reducing the graph is absolutely not possible.
Automatic Layout
Calculating layouts for large graphs can take a long time. Putting ten thousand nodes into a graph and running a layout algorithm is a usually a point where you have at least half a minute of waiting time. Most layout algorithms allow restricting the maximum duration (see, for example, maximumDuration). Note that such restrictions may result in a lower layout quality. Furthermore, the actual runtime may exceed the specified value since the layout algorithm still has to find a valid solution. Often, a good option is to run a complete layout only rarely and instead focus on incremental layouts of newly-added elements. The two main layout algorithms suitable for incremental use while keeping interaction fluid are HierarchicLayout and OrganicLayout. They can both be configured to move only a selected subset of nodes and leave most of the graph as it is.
The basics of incremental layout are discussed in detail in the Incremental Layout section.
Rendering Technique
yFiles offers different techniques to render visuals: SVG, Canvas, WebGL, and WebGL2 rendering. The default technique is SVG rendering. SVG rendering has many advantages like full customizability, styling with CSS, crisp text rendering, and support for animations and hover effects. For very large diagrams, on the other hand, the SVG DOM gets very large which might result in a loss of performance. Canvas and WebGL generally allow rendering larger graphs while item styling remains fully customizable. WebGL2 rendering offers the best performance, but is limited to a built-in set of styles, animations, and user interactions. It is possible to get the best of the SVG and WebGL2 techniques with level of detail rendering: crisp, detailed rendering on high zoom levels and fast, but simpler rendering on low zoom levels.
GraphOverviewComponent
In our demos there is often both a regular GraphComponent and a GraphOverviewComponent in a window. GraphOverviewComponent also has to render the graph, it still uses styles (albeit simpler ones), it creates visuals for its items, and so on. This also means that its updates can be costly with large graphs. The easiest remedy to that is by simply disabling the overview. However, replacing GraphOverviewComponent with a GraphComponent, using simple styles, following the recommendations below (especially regarding static graphs) and installing an OverviewInputMode is also an option.
GraphEditorInputMode
GraphEditorInputMode has a variety of sub-modes handling different tasks. Since they are all active at the same time they all determine more or less simultaneously whether they are responsible for a particular input event. Two sub-input modes of GraphEditorInputMode in particular are of note here, namely createEdgeInputMode and createBendInputMode. Both of them need to determine whether they hit something when a drag begins and in turn perform hit testing on all model items the moment a drag starts. This can cause a noticeable lag when starting a panning gesture on very large graphs. If that turns out to be problematic and the ability to create edges or bends is not needed, it’s easiest to disable those input modes on GraphEditorInputMode.
// 'graphComponent' is of type GraphComponent
const graphEditorInputMode = new GraphEditorInputMode()
graphEditorInputMode.createEdgeInputMode.enabled = false
graphEditorInputMode.createBendInputMode.enabled = false

graphComponent.inputMode = graphEditorInputMode
GraphViewerInputMode is not affected.
Styles
The very first thing that can be fixed in rendering large graphs is the time spent in the styles' updateVisualmethods. By default, everything is visible at all zoom levels and rendered in detail. In particular, labels often don’t need to be displayed at low zoom levels at all, as they are not readable anyway. Furthermore, PolylineEdgeStyle offers some visual niceties, such as clipping its path to the outline of the end nodes. Those cannot be seen at low zoom levels either.
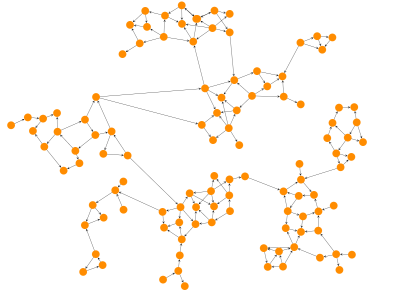
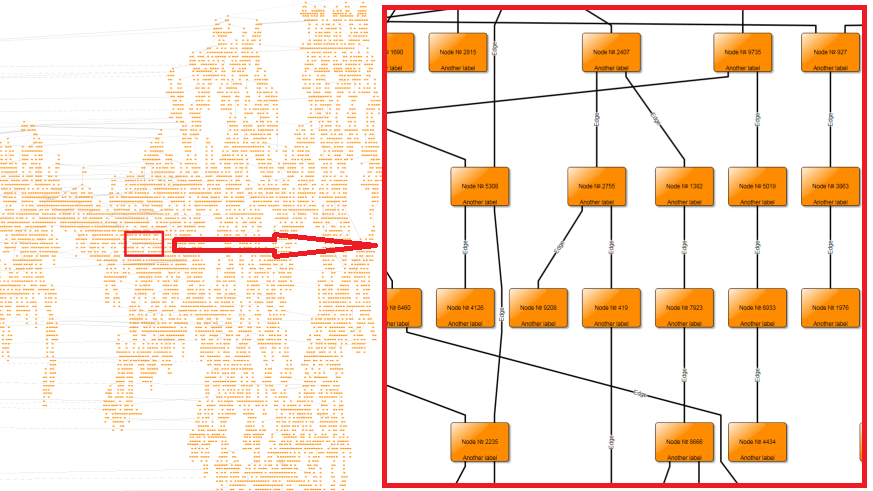
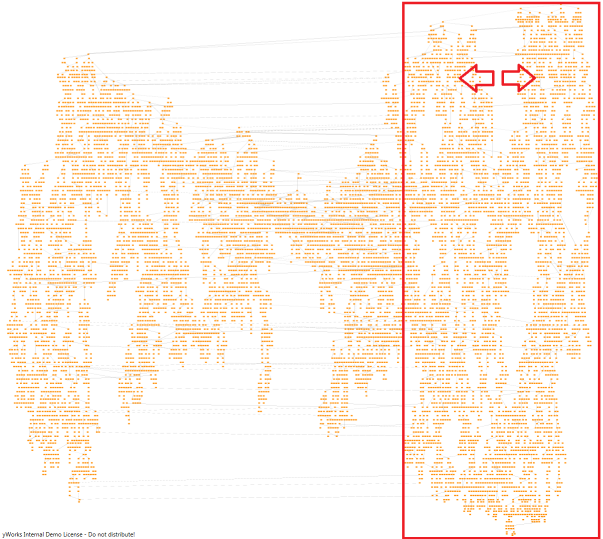
There are two main things that can be done about styles: First, we can employ level-of-detail rendering to avoid having expensive styles at low zoom levels where many items are visible. Level-of detail rendering means that complex rendering is used at higher zoom levels while the visualization is much simpler at low levels. The following figure Level-of-detail styles illustrates this: while complex rendering is used for high zoom levels (top left picture) a much simpler rendering is sufficient for low zoom levels (compare the pictures at the right).
| High Zoom Level | Low Zoom Level |
|---|---|
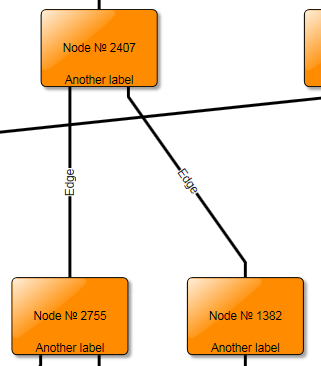 | 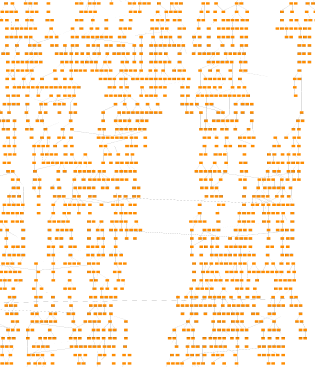 |
 |  |
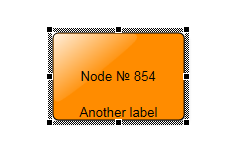
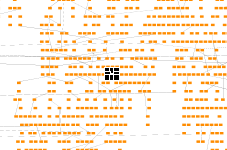
The cheapest styles in this respect are VoidNodeStyle, VoidEdgeStyle, VoidLabelStyle, and VoidPortStyle which simply hide their respective items. This makes most sense for labels but sometimes also for edges, depending on whether edges are necessary to see the graph structure. Generally, level-of-detail rendering can offer increasingly complex visualisations for all model items, depending on the zoom level, as shown in Level-of-detail-rendering of nodes, using the level-of-detail styles from the LargeGraphs demo.
// 'graph' is of type IGraph.
graph.nodeDefaults.style = new LevelOfDetailNodeStyle([
  {
    zoom: 0.0,
    style: new ShapeNodeStyle({
      shape: ShapeNodeShape.RECTANGLE,
      fill: Fill.DARK_ORANGE
    })
  },
  {
    zoom: 0.3,
    style: new ShapeNodeStyle({
      shape: ShapeNodeShape.ROUND_RECTANGLE,
      stroke: Stroke.BLACK,
      fill: Fill.DARK_ORANGE
    })
  },
  {
    zoom: 0.6,
    style: new ShapeNodeStyle({ fill: Fill.DARK_ORANGE, stroke: Stroke.BLACK })
  },
  { zoom: 1.0, style: new TemplateNodeStyle('NodeStyleTemplate') }
])// 'graph' is of type IGraph.
graph.nodeDefaults.style = new LevelOfDetailNodeStyle([
  {
    zoom: 0.0,
    style: new ShapeNodeStyle({ shape: ShapeNodeShape.RECTANGLE, fill: Fill.DARK_ORANGE })
  },
  {
    zoom: 0.3,
    style: new ShapeNodeStyle({
      shape: ShapeNodeShape.ROUND_RECTANGLE,
      stroke: Stroke.BLACK,
      fill: Fill.DARK_ORANGE
    })
  },
  { zoom: 0.6, style: new ShapeNodeStyle({ fill: Fill.DARK_ORANGE, stroke: Stroke.BLACK }) },
  { zoom: 1.0, style: new TemplateNodeStyle('NodeStyleTemplate') }
])
While the void styles are a good way of solving performance problems for lower zoom levels they have the obvious drawback that they don’t render anything. However, we can easily create dedicated styles that solve the main performance problems in rendering and still are useful at conveying shape and position of nodes, edges, and labels. ShapeNodeStyle works pretty well for low-fidelity rendering of nodes, labels are better hidden when they get too small, but edges lack an out-of-the-box solution for fast low-fidelity rendering.
Possible edge rendering optimizations for low zoom levels are:
- The edge is not clipped at the node outline. This takes advantage of the fact that edges are drawn below nodes by default and thus the node’s visual lies above the edge’s. However, if arrows are desired/needed and the ports are not already at the node boundary, then clipping is needed again, otherwise the arrow will end in the middle of a node. Using a level-of-detail style to switch from an edge style with arrows to another without is a viable option, though.
- Edge bends are not rendered, depending on the zoom level, which offers a simpler representation when full fidelity is not needed. This assumes that bends are mostly used for minor deviations from the overall edge shape — if bends are instead used to route an edge a long distance through the graph this results in a worse visualization of course. As usual, this depends very much on the graph and rendering bends even at lower zoom levels doesn’t have a large impact.
- Very short edges, such as those between close nodes in a cluster of nodes can be hidden. By taking the zoom level into account we can consider the actual on-screen length of the edge. In large graphs with many nodes that are close to each other and connected, this can prevent most edges from being rendered at all.
The FastEdgeStyle in the Rendering Optimizations demo
demonstrates how all these optimizations can be implemented.
The demo also includes a FastLabelStyle that can be used as an intermediary style between
VoidLabelStyle and DefaultLabelStyle. The actual bottleneck with labels is
a different one, though — calculating their position and layout,
especially with edge labels. This is further explored in Static Graphs.
For now the best advice is to keep
edge labels hidden as long as possible. Which nicely correlates to the fact that edge labels can add a lot of
visual noise at lower zoom levels and thus are not even very useful to show.
Virtualization
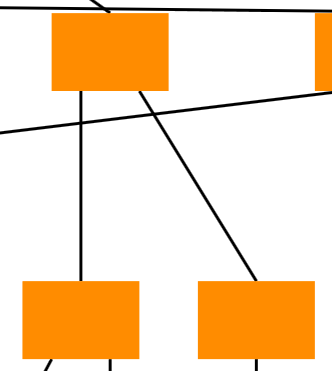
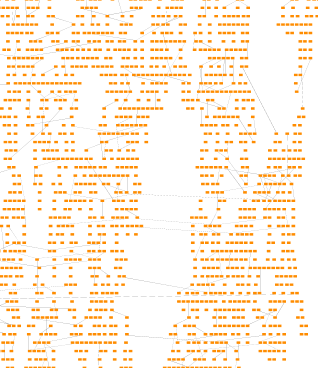
Virtualization in CanvasComponent trims the DOM to the elements that are actually visible. The benefit of this is obvious: after zooming into a small area of the graph only a few elements remain in the DOM (see Positive and negative aspects of virtualization, left picture). Virtualization works well when a few hundred visuals or less need to be removed or added at a time but can result in significant stutter if thousands of elements are affected. The latter happens typically while panning or zooming the viewport with a large graph at a low zoom level. (See Positive and negative aspects of virtualization, right picture: when the graph is panned to the right all elements which are moved outside the viewport have to be removed from the DOM. This can considerably slow down the panning.)
There is no easy solution to this as virtualization is both necessary at higher zoom levels and a burden at lower zoom levels. Turning off virtualization below a given zoom level improves performance of panning the viewport but it can create a noticeable delay when crossing the zoom level threshold while zooming in either direction. This delay happens because when crossing the threshold all elements suddenly need their visuals created, even if outside the viewport. The exact threshold value thus needs to be determined empirically with the graph in question to find a suitable trade-off between pause length while zooming and frame rate while panning.
Virtualization depends on whether a style’s IVisibilityTestable
considers an item visible. If an item changes its
visibility to false it will be removed from the DOM and re-created and added again when it becomes
visible again. So to turn off virtualization (i.e. never remove items from the DOM) we just need to consider
an item always visible, as seen in Turning off virtualization in a style that derives from NodeStyleBase
/**
 * @param {!ICanvasContext} context
 * @param {!Rect} rectangle
 * @param {!INode} node
 * @returns {boolean}
 */
isVisible(context, rectangle, node) {
  if (context.zoom < 0.1) {
    return true
  }
  return super.isVisible(context, rectangle, node)
}
isVisible(context: ICanvasContext, rectangle: Rect, node: INode): boolean {
  if (context.zoom < 0.1) {
    return true
  }
  return super.isVisible(context, rectangle, node)
}
The Rendering Optimizations demo has style decorators for node, edge and label styles that can be used to turn virtualization off at a configurable zoom level. In theory that functionality could be integrated directly into the level-of-detail styles as well.
Selections
Large graphs, in particular those that are editable, sometimes make large selections necessary. There are two things that hinder this by default:
- Selection handles can be somewhat expensive to draw, especially when hundreds or thousands of items are selected.
- The default selection decoration involves at least another visual and two coordinate system transformation, which can be costly with many items selected.
The value of having thousands of selection handles visible, obscuring everything in the graph and being unable to properly interact with them is dubious at best, so selection handles should be disabled on the input mode. Depending on whether they are still needed in some circumstances this choice can very well be made depending on how many items are selected or the current zoom level. However, switching them off or on requires to re-check all selected items whether handles should be shown (by calling requeryHandles) which can be slow again.
// 'geim' is of type GraphEditorInputMode

// disabling selection handles
geim.showHandleItems = GraphItemTypes.NONE
// enabling selection handles
geim.showHandleItems = GraphItemTypes.ALL
Custom selection decorations can be set on the GraphDecorator instance obtained from IGraph.decorator. An easy way of writing a custom decorator for a model item is shown in the Rendering Optimizations demo. It involves writing a custom style and one of the StyleDecorationInstallers. The basic steps are shown in Setting a custom node selection decoration with NodeStyleDecorationInstaller. The important part for good performance here is that the style is still set up in world coordinates (cf. the zoomPolicy property of the installer) and then performs the necessary adaptations itself, e.g. setting the stroke width so that it appears constant in view coordinates by scaling it with the zoom level.
const installer = new NodeStyleDecorationInstaller({
  nodeStyle: new FastNodeSelectionStyle(null, new Stroke(Fill.RED, 4)),
  zoomPolicy: StyleDecorationZoomPolicy.WORLD_COORDINATES,
  margins: Insets.EMPTY
})
// 'graph' is of type IGraph.
graph.decorator.nodeDecorator.selectionDecorator.setImplementation(installer)
Static Graphs
Static graphs in this section refer to graphs and applications where the following statements hold true:
- The application acts mostly as a viewer for a given graph. This can allow small edits on the graph, but global ones, such as interactively moving hundreds of nodes, are problematic.
- The graph is mostly static and changes only rarely. This can mean that the graph is only ever changed from a few well-defined places in code, users don’t edit too much at the same time and layouts that change large parts of the graph happen only infrequently.
Such applications allow more aggressive measures that can ignore changes to the graph, because the graph usually doesn’t change, or only on few occasions. These optimizations change the graph or how it is displayed by assuming the graph to be unchanging. Changes to the graph can make toggling the respective optimization necessary, which is costly to do frequently. This is basically what the word mostly refers to in the points above.
Label Models
As mentioned before, determining label placement and orientation is particularly expensive, especially with edge labels. Most label models place the label near the edge and thus need to know the edge’s path to determine where the label is. Sometimes also a tangent on the path is needed to determine the label’s orientation. Even if a label’s location does not change, this slows down visual updates on the graph because the label’s style doesn’t know that its location didn’t change.
The easiest approach here is to replace the label models by a FreeLabelModel, which, instead of storing the relative position to its owner, just records the absolute position and orientation. This means that when queried for its position and bounding box the label model has much less to do. A code snippet on how to change the label models can be found in Changing all label models in a graph to a FreeLabelModel while retaining their positions.
for (const l of graph.labels) {
  const freeModelFinder = FreeLabelModel.INSTANCE.lookup(ILabelModelParameterFinder.$class)
  const finder =
    freeModelFinder instanceof ILabelModelParameterFinder ? freeModelFinder : DefaultLabelModelParameterFinder.INSTANCE
  const param = finder.findBestParameter(l, originalModel, l.layout)
  graph.setLabelLayoutParameter(l, param)
}
The downside of this approach is, that if the label’s owner moves or otherwise changes, the label stays at its position. However, changing the label model back to its previous model works with pretty much the same code as shown in Changing all label models in a graph to a FreeLabelModel while retaining their positions. So one way of benefiting from better performance when viewing the graph while still allowing edits would be to change the label models back and forth as needed, perhaps even just for the items being manipulated.
CanvasObjectDescriptor
Everything rendered by a CanvasComponent is placed in a tree of ICanvasObjects, each of which has a ICanvasObjectDescriptor that can be queried for objects to perform hit-testing, visibility checks, visual updates, etc. In most respects this descriptor acts very much as a style and the default descriptor in fact just delegates to an item’s style for those things. But each descriptor also has an isDirty method that is queried for whether an update is needed to a given ICanvasObject. The default implementation always returns true here. Implementing a custom descriptor that either returns false, or better yet, delegates to its ICanvasObject's dirty flag results in nearly all visibility tests and visual updates being omitted, which can improve performance considerably. The drawback here is that indeed nothing at all is updated. This includes:
- The level-of-detail styles from above won’t work anymore as they require a call to updateVisual every now and then.
- When an item changes (label text, node size or position, edge bends, styles in general) nothing happens.
This is something that needs to be triggered explicitly in response to anything that requires an update. Ideally the custom descriptor implementation delegates isDirty to the ICanvasObject's dirty flag, which is re-set to false after every update by CanvasComponent. Thus walking through the Canvas Object Tree and setting each ICanvasObject's dirty flag to true is an effective way of triggering an update while retaining the benefits of the custom descriptor. This is also the approach used in the Rendering Optimizations demo. Updating the entire canvas object tree is also fairly fast and could be done in event handlers for the various events the input mode provides.