| Chapter 2. Displaying and Editing Graphs | ||
|---|---|---|
| Prev | Next | |
Table of Contents
This chapter shows how to display a graph in a specialized Flex UI component and how user interaction with both graph elements and the component containing a graph is handled. It presents the types that are responsible for the visual representation of graph elements and explains their contribution to the "look and feel" of an application.
yFiles FLEX provides user interface (UI) functionality comprising two main aspects, namely the presentation of a graph structure to the user and the interaction of a user with the graph structure.
The Model-View-Controller (MVC) paradigm is reflected in yFiles FLEX, i.e., among the classes there can be distinguished the following three types, each having specific responsibilities:
In terms of MVC, the types around interface
IGraph![]() and around interface
IVisualStyle
and around interface
IVisualStyle![]() make up the
model which holds data and state.
Class GraphCanvasComponent
make up the
model which holds data and state.
Class GraphCanvasComponent![]() provides
the view which presents the information to the user.
Finally, the so-called input modes, i.e., in particular, class
GraphEditorInputMode
provides
the view which presents the information to the user.
Finally, the so-called input modes, i.e., in particular, class
GraphEditorInputMode![]() enable
convenient modification of the model by means of a variety of supported user
gestures.
enable
convenient modification of the model by means of a variety of supported user
gestures.
The respective parts of MVC are further described in the following sections:
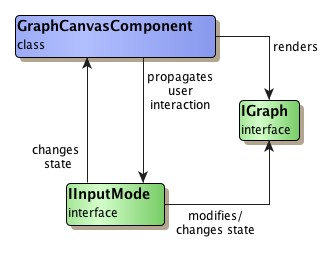
Figure 2.1, “Model-View-Controller paradigm in yFiles FLEX” depicts the interdependencies of the three parts. The view, an instance of class GraphCanvasComponent, displays the model consisting of an IGraph and the INode, IEdge, ILabel, etc. model item instances it contains. The view also propagates user interface events to the controller(s): IInputMode implementations, with GraphEditorInputMode being the most comprehensive. According to these events, the controllers then change state on either view or model.
|
Copyright ©2007-2015, yWorks GmbH. All rights reserved. |