| View Implementations | ||
|---|---|---|
| Prev | Chapter 2. Displaying and Editing Graphs | Next |
In terms of the Model-View-Controller (MVC) paradigm, the component that is
used to display a graph (i.e., the "model") is a "view."
It is responsible for presenting the model to the user and also for propagating
events generated by the user to the proper controller classes that handle user
interaction.
In yFiles FLEX, this view is provided by the graph canvas, an instance of type
GraphCanvasComponent![]() .
.
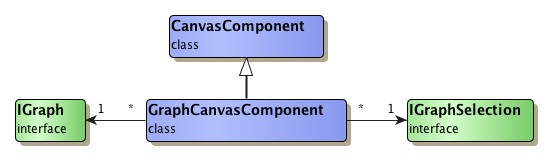
Class GraphCanvasComponent![]() is a Flex
UI component that presents a graph model to the user.
It is a direct descendant of class CanvasComponent, which provides generic
support for displaying arbitrary graphical objects
(see description below).
The graph canvas is also often simply referred to as the "canvas."
is a Flex
UI component that presents a graph model to the user.
It is a direct descendant of class CanvasComponent, which provides generic
support for displaying arbitrary graphical objects
(see description below).
The graph canvas is also often simply referred to as the "canvas."
Figure 2.36, “GraphCanvasComponent interrelations” depicts the GraphCanvasComponent interrelations with yFiles FLEX types.
The graph model is an implementation of interface
IGraph![]() , which is the central
graph structure type.
It represents the "model" in MVC terminology and is registered with the graph
canvas via the
graph
, which is the central
graph structure type.
It represents the "model" in MVC terminology and is registered with the graph
canvas via the
graph![]() property.
property.
// 'gc' is of type com.yworks.ui.GraphCanvasComponent.

// Set a new graph with this GraphCanvasComponent.
gc.graph = new DefaultGraph();
Similar to its base type, GraphCanvasComponent does not provide any means for handling user interaction. In order to add support for user interaction, "controllers" can be conveniently registered with a GraphCanvasComponent instance.
In yFiles FLEX, a controller is a so-called input mode, an implementation of
interface IInputMode![]() .
The inputModes
.
The inputModes![]() property can be used to register input modes.
property can be used to register input modes.
The most comprehensive controller type that provides support for handling user interaction is class GraphEditorInputMode, it is a perfect match for the graph canvas. GraphEditorInputMode is described in the section called “User Interaction”.
// 'gc' is of type com.yworks.ui.GraphCanvasComponent.

// Add a GraphEditorInputMode to this graph canvas to handle user interaction.
gc.inputModes.addItem(new GraphEditorInputMode(gc.graph));
Class GraphCanvasComponent offers all the functionality exposed by CanvasComponent, including, e.g.:
and additionally makes available comfortable graph model-specific functionality:
Using the GraphCanvasComponent along with a GraphEditorInputMode that handles user interaction is presented in the GraphCanvas demo application.
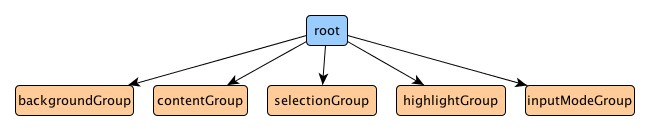
The GraphCanvasComponent prepares a set of canvas objects groups in the scene graph that are designed to hold distinct sets of canvas objects:
Figure 2.37, “Canvas object groups prepared by the GraphCanvasComponent” depicts the initial order of these groups in the scene graph. The background group is the first child of the scene graph's root element, the input mode group is the last child. Consequently, any temporary decorations installed by input modes will be rendered frontmost while background graphics will be rendered behind all other canvas content.
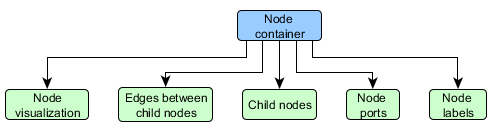
The contentGroup in turn contains further canvas object groups (or in fact a hierarchy of canvas object groups) to assure a certain render order for the canvas objects of the model items (see the section called “Z-Ordering”). What canvas object groups (also called 'layers') are used and in what group a model item is put, depends on the layer policies set for edges, labels and ports. The effects of the different policies are explained in the section called “Layer Policies”.
Using the default policies, one canvas object group with the following sub layers is created for each node in the graph:
Class GraphCanvasComponent provides convenient application-level functionality including clipboard and Undo/Redo support. Also, the graph model can be read from GraphML graph structure exchange file format easily. The available file I/O methods are listed in API Excerpt 2.8, “Methods for reading and writing the graph structure”.
API Excerpt 2.8. Methods for reading and writing the graph structure
// Reading in the graph model from GraphML.
loadGraphFromURL(URL:String, ioHandler:IOHandler = null,
                 theGraph:IGraph = null):void
loadGraphFromXML(xml:XML, ioHandler:GraphMLIOHandler = null,
                 theGraph:IGraph = null):void
By means of a GraphClipboard![]() instance that is associated with a GraphCanvasComponent, default clipboard
support covering Cut, Copy, and Paste actions is provided.
For further control, this instance can be obtained via the
clipboard
instance that is associated with a GraphCanvasComponent, default clipboard
support covering Cut, Copy, and Paste actions is provided.
For further control, this instance can be obtained via the
clipboard![]() property.
property.
Class GraphCanvasComponent offers convenient access to the Undo/Redo functionality provided by the UndoEngine that is bound to the graph. API Excerpt 2.10, “Undo/Redo-related methods” lists the methods that can be used.
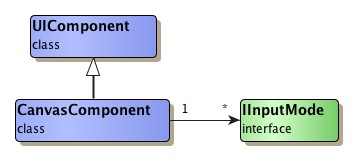
Class CanvasComponent![]() is a Flex
UI component that can be used to render arbitrary graphical objects in an
efficient manner.
It provides a versatile supporting infrastructure that allows to conveniently
create a model consisting of such objects and modify it freely.
CanvasComponent also supports high-performance panning and zooming of graphical
content.
is a Flex
UI component that can be used to render arbitrary graphical objects in an
efficient manner.
It provides a versatile supporting infrastructure that allows to conveniently
create a model consisting of such objects and modify it freely.
CanvasComponent also supports high-performance panning and zooming of graphical
content.
CanvasComponent is a "view" in MVC terminology, and as such displays a "model." It does not provide any means for handling user interaction. In order to add support for user interaction, "controllers" can be conveniently registered with a CanvasComponent instance.
In yFiles FLEX, a controller is a so-called input mode, an implementation of
interface IInputMode![]() .
The inputModes
.
The inputModes![]() property can be used to register input modes.
property can be used to register input modes.
The controller types that provide support for handling user interaction are described in the section called “User Interaction”.
Example 2.29. Installing multiple input modes
// 'canvasComponent' is of type com.yworks.canvas.CanvasComponent.

canvasComponent.inputModes.addItem(new ContextMenuInputMode());
canvasComponent.inputModes.addItem(new MyInputMode());
Out-of-the-box, class CanvasComponent already supports a wide variety of useful features that can be conveniently enabled/disabled and customized. Included is, for example:
There are different coordinate spaces used for the model itself and for its presentation in the canvas, the so-called "world coordinates" and the view coordinates.
The common thing to both world and view coordinate space is the way coordinates increase with each direction. Coordinates on computer screens most commonly increase from left to right and from top to bottom. Note that this is diametrical to the normal Cartesian coordinate system known from school where coordinates increase from left to right and from bottom to top.
The view coordinates always start with (0,0) for the upper left corner and increase to the right and to the bottom. The coordinates of the lower right corner accordingly equals to (view_width-1, view_height-1), i.e., the view coordinates directly reflect the viewport's size. (Note that the canvas is also referred to as "the viewport" here. This term is most notably used whenever the dimensions of the canvas are of particular importance or the clipping is discussed, i.e., the visible part of the model.)
The world coordinates, in contrast, are those valid in the model, i.e., they denote the proper locations that are set for a node's upper-left corner or the control points of an edge.
One characteristic of world coordinates is that they can have negative values, while view coordinates are always positive.
The mapping from one coordinate space to the other happens automatically and is
achieved using the notion of the so-called "view point" and scaling.
The view point determines the world coordinates that get directly mapped to the
upper-left corner of the viewport, i.e., it defines where the view's origin
lies in the world coordinates's two-dimensional space.
The viewPoint![]() property can be used to control the view point.
property can be used to control the view point.
An additional scaling factor that can be applied to the world coordinates
determines the zoom level with which the canvas scales the model's
presentation.
To control the zoom level, CanvasComponent provides the
zoom![]() property.
property.
API Excerpt 2.11, “Coordinate conversion methods” lists the methods that can be used when explicit coordinate conversion is required.
API Excerpt 2.11. Coordinate conversion methods
// From world to view coordinates...
toViewCoordinates(p:IMutablePoint):void

// ...and vice-versa.
toWorldCoordinates(p:IMutablePoint):void
Example 2.30, “Coordinate conversion in detail” presents the instructions for coordinate conversion in detail.
Example 2.30. Coordinate conversion in detail
// From world to view coordinates...
IPointSetter(p).x = (IPoint(p).x - viewPoint.x) * zoom;
IPointSetter(p).y = (IPoint(p).y - viewPoint.y) * zoom;

// ...and vice-versa.
IPointSetter(p).x = IPoint(p).x / zoom + viewPoint.x;
IPointSetter(p).y = IPoint(p).y / zoom + viewPoint.y;
The actual clipping of the world coordinate space that is displayed in the
viewport can be conveniently modified using the methods shown in
API Excerpt 2.12, “Methods that affect the viewport”.
Additionally, CanvasComponent provides the
zoom![]() property to
control the scaling factor used by the canvas.
property to
control the scaling factor used by the canvas.
API Excerpt 2.12. Methods that affect the viewport
// Adjusts the view port to fully encompass the current content rectangle.
fitContent():void

// Updates the content rectangle and adjusts the
// viewport to encompass the contents.
fitGraphBounds():void

// Sets the zoom level and view port center to the given values.
zoomTo(px:Number, py:Number, theZoom:Number):void
To test whether a canvas object lies at a given coordinate, or to collect all canvas objects at a given coordinate, CanvasComponent provides the methods listed in API Excerpt 2.13, “Methods for collecting hit elements”.
Note that hit-testing relies on the availability of an IHitTestable implementation for a canvas object. Normally, such an implementation is returned by a canvas object's descriptor. "Simple" canvas objects, i.e., implementations of interface IPaintable or IDisplayObjectCreator, however, do not provide a descriptor and hence do not support hit-testing.
API Excerpt 2.13. Methods for collecting hit elements
isCanvasHit(target:DisplayObject, stageX:Number, stageY:Number):Boolean

getCanvasObject(worldX:Number, worldY:Number):ICanvasObject
getCanvasObjects(worldX:Number, worldY:Number):Iterable

// Execute a callback function for all canvas objects that are located at
// the given coordinates.
collectCanvasObjects(x:Number, y:Number, elementFoundCallback:Function):void

// Iterate all canvas objects that are located at the given coordinate,
// belong to the subtree defined by the given root group
// and that are allowed by the provided filter function.
iterateHits(x:Number, y:Number,
            root:ICanvasObjectGroup=null, filter:Function=null):Iterator
The hitTestRadius![]() property of class CanvasComponent can be used to control the hit-testing
sensitivity that is used when mouse click events are processed.
Note that the value for this property is given in view coordinates rather than
world coordinates, which enables precise testing behavior especially with small
zoom levels.
property of class CanvasComponent can be used to control the hit-testing
sensitivity that is used when mouse click events are processed.
Note that the value for this property is given in view coordinates rather than
world coordinates, which enables precise testing behavior especially with small
zoom levels.
Class CanvasComponent provides convenient application-level functionality for printing the content of the canvas. In addition to default printing functionality, the CanvasComponent also provides facilities to completely customize printing of the canvas content.
API Excerpt 2.14. Canvas content printing methods
// Printing the canvas content.
print( bitmap:Boolean=true, borderSize:uint=5, backgroundFill:*=0xFFFFFF ):void

// obtain a sprite that represents the current canvas content.
// the sprite can be printed using a custom configured PrintJob.
createSprite():Sprite
Central to the services that CanvasComponent provides is the so-called "scene graph," the supporting infrastructure that holds the model of graphical objects.
The scene graph is a data structure maintained by a CanvasComponent object. It is used to hold "canvas objects," elements that provide the logic for rendering graphical objects in the canvas, and also to determine the actual rendering order of these objects.
The scene graph most often is a tree-like structure that consists of inner
nodes and leaf nodes.
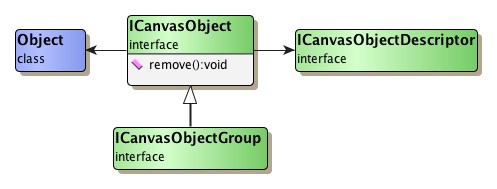
The leaf nodes are always actual canvas objects, which are implementations of
interface ICanvasObject![]() .
The inner nodes are so-called groups that can be used to partition the set of
canvas objects in any suitable manner.
Groups are implementations of interface
ICanvasObjectGroup
.
The inner nodes are so-called groups that can be used to partition the set of
canvas objects in any suitable manner.
Groups are implementations of interface
ICanvasObjectGroup![]() .
A scene graph has at least one group, the root group, which cannot be removed.
.
A scene graph has at least one group, the root group, which cannot be removed.
An ICanvasObject bundles a custom so-called user object and an
ICanvasObjectDescriptor![]() .
The intention of the former is to hold any data specific to a given graphical
object, like, e.g. its size and its location in the canvas.
The latter is used by the CanvasComponent to obtain the actual logic related to
all rendering and interaction aspects for the corresponding canvas object.
.
The intention of the former is to hold any data specific to a given graphical
object, like, e.g. its size and its location in the canvas.
The latter is used by the CanvasComponent to obtain the actual logic related to
all rendering and interaction aspects for the corresponding canvas object.
CanvasComponent also supports "simple" canvas objects that provide the
rendering logic themselves and can do without an explicit descriptor.
These canvas objects consist of an
IDisplayObjectCreator![]() or
IPaintable
or
IPaintable![]() implementation.
implementation.
API Excerpt 2.15, “Methods for adding canvas objects to the scene graph” lists the CanvasComponent methods that
can be used to add canvas objects to the scene graph.
To remove a canvas object from the scene graph, the
remove()![]() method can
be used.
method can
be used.
The order in which canvas objects are added to a group (or the root group, when no explicit group is specified) directly influences their rendering order: canvas objects that are added later are rendered in front of those added earlier.
API Excerpt 2.15. Methods for adding canvas objects to the scene graph
// Adding canvas objects which consist of user object and descriptor.
addCanvasObject(userObject:Object,
                descriptor:ICanvasObjectDescriptor = null,
                group:ICanvasObjectGroup = null):ICanvasObject

// Adding IDisplayObjectCreator implementations (simple canvas objects).
addDisplayObjectCreator(creator:IDisplayObjectCreator,
             group:ICanvasObjectGroup = null ):ICanvasObject

// Adding IPaintable implementations (simple canvas objects).
addPaintable(paintable:IPaintable,
             group:ICanvasObjectGroup = null):ICanvasObject
To add further groups to the scene graph, the CanvasComponent methods listed in
API Excerpt 2.16, “Methods for adding groups to the scene graph” can be used.
To remove a group from the scene graph, the
remove()![]() method can
be used.
method can
be used.
The order in which groups are added to another group (or the root group, when no explicit group is specified) directly influences the rendering order: the content of groups that are added later is rendered in front of the content of those added earlier.
API Excerpt 2.16. Methods for adding groups to the scene graph
// Adding to the root group of the scene graph.
addGroup():ICanvasObjectGroup

// Adding to another group of the scene graph.
addGroupToGroup(toGroup:ICanvasObjectGroup):ICanvasObjectGroup
The scene graph is also used to determine the rendering order of graphical objects. To this end, it is traversed in depth-first manner when a redraw is requested. The rendering of canvas objects is done in the order they are traversed, i.e., objects that are traversed later are drawn in front of earlier traversed ones.
Initially, the rendering order can be determined by the order in which canvas objects are added to a group and the order in which groups are added to another group. Once groups and canvas objects are in the scene graph, the methods listed in API Excerpt 2.17, “Methods from ICanvasObjects for changing the rendering order of canvas objects” can be used to change the rendering order easily.
API Excerpt 2.17. Methods from ICanvasObjects for changing the rendering order of canvas objects
// Changing a canvas object's "position" within the group it resides in.
toFront():ICanvasObject
toBack():ICanvasObject
raise():ICanvasObject
lower():ICanvasObject

// When 'reference' is in another group, the canvas object is moved there.
after(reference:ICanvasObject):ICanvasObject
before(reference:ICanvasObject):ICanvasObject
Class GraphOverviewComponent![]() is a UI
component that presents an overview of the graph model to the user, that always
shows the graph model in its entirety.
Typically, it has a GraphCanvasComponent instance associated and displays the
same graph as this instance.
The GraphCanvasComponent instance can be either set at creation time or via the
graphCanvas
is a UI
component that presents an overview of the graph model to the user, that always
shows the graph model in its entirety.
Typically, it has a GraphCanvasComponent instance associated and displays the
same graph as this instance.
The GraphCanvasComponent instance can be either set at creation time or via the
graphCanvas![]() property.
property.
Superposed on the presentation of the overview is a visual feedback for the graph's visible area defined by the associated GraphCanvasComponent instance. This superposed rectangle can be moved using the mouse, thereby moving the visible area accordingly. GraphOverviewControl also supports mouse wheel zooming and propagates the new zoom to the GraphCanvasComponent instance it has associated.
To reduce drawing complexity, GraphOverviewComponent does not display the graph in the same manner as the associated GraphCanvasComponent instance. Instead, the graph is displayed with less details: labels are omitted, there are no arrows at the ends of edges and nodes are always drawn as rectangles.
Example 2.31, “Adding a GraphOverviewComponent to the Canvas” shows how an overview component can be added on top of the graph canvas using MXML.
Example 2.31. Adding a GraphOverviewComponent to the Canvas
<mx:Canvas width="100%" height="100%" id="canvasContainer">
  <!-- The canvas that renders the graph -->
  <yworks:GraphCanvasComponent id="graphCanvas" width="100%" height="100%" />

  <!-- show an overview component on top of the canvas -->
  <mx:Canvas id="overviewCanvas"
             x="20" y="20" width="210" height="210"
             backgroundColor="0xFFFFFF" backgroundAlpha="0"
             borderColor="0xDDDDDD" borderThickness="3" borderStyle="solid"
             dropShadowEnabled="true" dropShadowColor="0xEEEEEE"
             showEffect="{showEffect}" hideEffect="{hideEffect}"
             horizontalScrollPolicy="off" verticalScrollPolicy="off">
    <yworks:GraphOverviewComponent id="overview"
                                   x="2" y="2" width="98%" height="98%"
                                   graphCanvas="{graphCanvas}"
                                   backgroundAlpha="0.8"/>
  </mx:Canvas>
</mx:Canvas>
|
Copyright ©2007-2015, yWorks GmbH. All rights reserved. |