Tables and Swimlanes
Partitioned layouts, tabular layouts, and, in particular, the special case of swimlane layouts, are supported by the LayoutGrid class.
This class specifies a grid that consists of rows and columns, and the grid cells that result from the rows and columns. Each node can be assigned to a single cell or a set of consecutive grid cells and will stay in these cells during layout. In addition to the structure, the class stores geometric information about rows and columns, for example, a row holds the height, minimumHeight, and position.
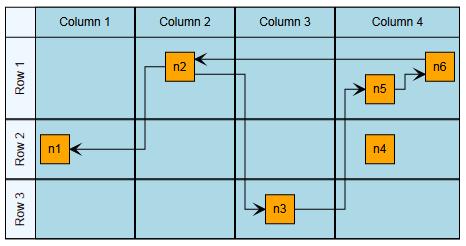
The layout of a table shows a tabular layout. Note the layout grid cells that result from the rows and columns.
The following layout and edge routing styles support a defined LayoutGrid:
-
Tabular Layout (only nodes, only a single node per cell)
Furthermore, the layout stage GenericLayoutGridStage offers generic support for grid structures. To configure the partition grid for the stage, use its layout data class.
|
Note
|
If an IGraph contains tables, applying a layout automatically creates a corresponding layout graph model with tabular information. Ultimately, this setup is done by the TableLayoutConfigurator class which creates a LayoutGrid of the Table. LayoutExecutor provides access to its TableLayoutConfigurator instance for advanced configuration and customization. |
private populateAndLayoutTable(
  graphComponent: GraphComponent,
  table: ITable
): void {
  const graph = graphComponent.graph

  // create a top-level group node and bind the table to it
  const parent = graph.createGroupNode(
    null,
    new Rect(0, 0, 10, 10),
    new TableNodeStyle(table)
  )

  // create some rows and columns
  const row1 = table.createRow()
  const row2 = table.createRow()
  const row3 = table.createRow()
  const column1 = table.createColumn()
  const column2 = table.createColumn()
  const column3 = table.createColumn()
  const column4 = table.createColumn()

  // populate some of the cells with nodes
  const n1 = this.createNodeInCell(graph, parent, row2, column1)
  const n2 = this.createNodeInCell(graph, parent, row1, column2)
  const n3 = this.createNodeInCell(graph, parent, row3, column3)
  const n4 = this.createNodeInCell(graph, parent, row2, column4)
  const n5 = this.createNodeInCell(graph, parent, row1, column4)
  const n6 = this.createNodeInCell(graph, parent, row1, column4)

  // connect them with some edges
  graph.createEdge(n2, n1)
  graph.createEdge(n2, n3)
  graph.createEdge(n3, n5)
  graph.createEdge(n5, n6)
  graph.createEdge(n6, n2)

  // create a layout algorithm that supports tables (i.e., layout grid)
  const hierarchicalLayout = new HierarchicalLayout()
  hierarchicalLayout.layoutOrientation = 'left-to-right'

  // and apply it to the graph
  graphComponent.applyLayoutAnimated(hierarchicalLayout, '1s')
}

// Create a node in the center of the given cell.
private createNodeInCell(
  graph: IGraph,
  parent: INode,
  row: IRow,
  column: IColumn
): INode {
  const node = graph.createNode(parent)
  graph.setNodeCenter(
    node,
    new Point(column.layout.center.x, row.layout.center.y)
  )
  return node
}
The Table Editor demo shows in detail how to create and automatically lay out tables.