| Chapter 1. Preface | ||
|---|---|---|
| Prev | Next | |
Table of Contents
yFiles FLEX Client Layout Extension is an ActionScript class library that provides algorithms for analysis and automatic layout of graphs, diagrams, and networks. It complements the extensive yFiles FLEX class library for the Adobe Flex framework. Together, they can be used to develop sophisticated Adobe Flash Player-based diagramming applications.
This chapter gives an overview what kind of purposes yFiles FLEX Client Layout Extension serves, and what kind of application domains it addresses.
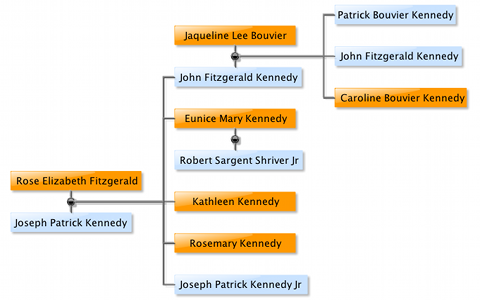
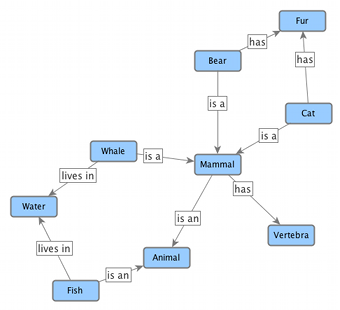
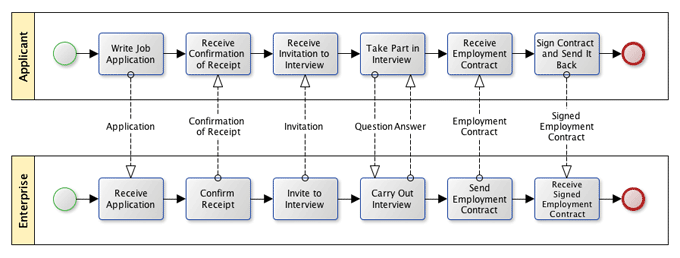
Diagrams of any kind naturally arise in a wide variety of application domains. The diagrams encountered commonly comprise entities together with their relationships. Entities are usually represented by some kind of object, e.g., a colored rectangle, and the relationships are usually represented by a connecting line with or without some kind of decoration at its ends. Figure 1.1, “Different kinds of diagrams” shows some examples of diagrams.
"A diagram is worth a thousand words." is a popular proverb which best expresses the benefits of using diagrams:
However, these properties strongly depend on the quality of a diagram. And the task of making legible diagrams is often tedious and moreover error-prone when done by hand. Sketching even small data sets can become awkward enough to forsake entirely.
With large data sets the problem of making high-quality, easy-to-understand diagrams aggravates. Doing it by hand is no longer an alternative, so the need for an automatic generation grows.
Diagrams in the common sense, i.e., some sort of entities together with connecting lines as described above, are closely related to the mathematical notion of a "graph." Basically, this means that diagrams and graphs serve the same purpose, the two concepts are interchangeable. Hence, a question that arises in the context of a diagram is equally a question concerning a graph.
Formally, a graph is defined as a tuple of two sets, a node set and an edge set. A "node" in this definition is the equivalent of an entity, while an "edge" represents a connecting line, i.e., a relationship between entities.
There is a variety of terms used to refer to the mathematically coined "node" and "edge," however in the course of this document we will stick to the original names as often as possible. See the glossary for more graph structure terminology widely used in this documentation.
|
Copyright ©2010-2015, yWorks GmbH. All rights reserved. |