The DatabaseDemo application builds and displays a simple graph that represents part of a company's organizational structure. It uses a simplified database setup where the data corresponds to the table shown in Figure 1.1, “The employees table from DatabaseDemo's sample database”.
The graph elements are derived from the data in the table in the following way:
- each row is turned into a node
- the data from the supervisor column is used to create edges between nodes
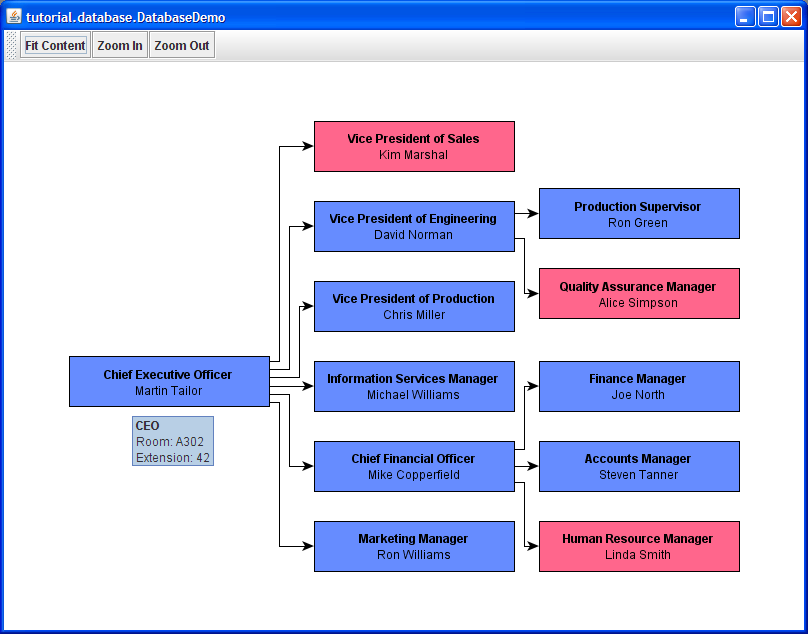
Figure 1.2, “DatabaseDemo builds a small sample graph from a simplified database setup” shows the application with the resulting organization chart.
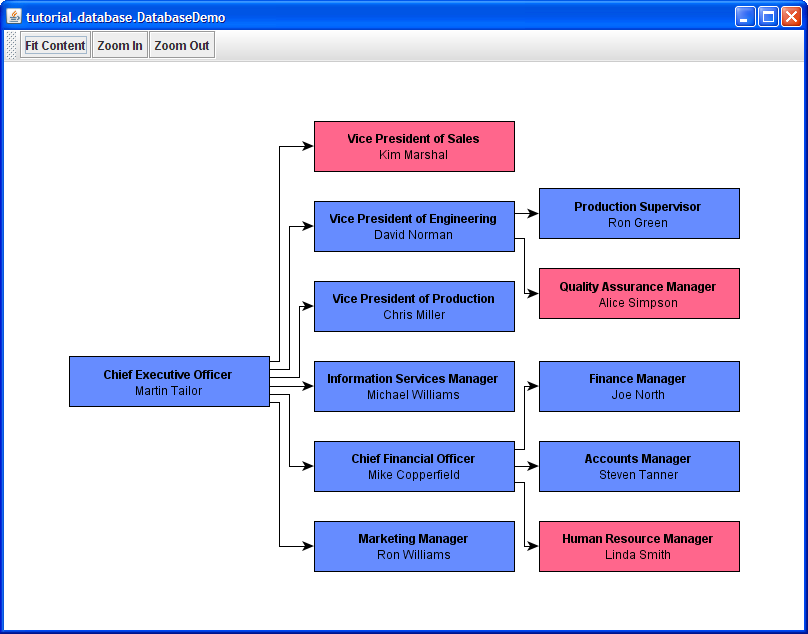
An organization chart is an example for a tree structure, which is a quite common type of diagram. Tree structures have special properties, for example, there is exactly one distinct "root node," which has no incoming edges (cf. 'Chief Executive Officer' to the left); all other nodes have exactly one incoming edge. The yFiles for Java diagramming library provides a number of specialized tree layout algorithms that can be used to calculate an automatic layout for this type of diagram. We will discuss layout algorithms later, in the section called “Automatic Layout”.
The DatabaseDemo application uses a modified variant of the SimpleGraphViewer5 application built in the Creating a Simple Graph Viewer trail to present the graph structure. The initial application setup shown in Example 1.1, “DatabaseDemo constructor” illustrates how the graph viewer is used.
Example 1.1. DatabaseDemo constructor
public DatabaseDemo() {
  sgv = new SimpleGraphViewer5(new Dimension(800, 600), getClass().getName()) {
    // Overridden since we need other default values.
    protected void configureDefaultRealizers(Graph2D graph) {
      // Add an arrowhead decoration to the target side of the edges.
      graph.getDefaultEdgeRealizer().setTargetArrow(Arrow.STANDARD);
      // Set the node size and some other graphical properties.
      NodeRealizer defaultNodeRealizer = graph.getDefaultNodeRealizer();
      defaultNodeRealizer.setSize(200, 50);
    }
  };
  graph = sgv.getGraph();
  sgv.getView().addViewMode(new TooltipMode());
}
The modification to the viewer is an override to configure the graph's default realizers for the application's needs. Basically, we set a uniform node size that can encompass the label texts of each node. (Later on, we will also take a look at other ways of determining node sizes.)
The last line in the constructor adds an additional view mode to the viewer, we will ignore this for the moment, but discuss it in the section called “Building the Graph, Part 3: Presenting Data” in more detail.
The DatabaseDemo's start method, which is invoked directly after the application's initialization, clearly presents the steps that are performed:
- database driver setup
- creating the graph structure from the database's data
- performing an automatic layout
- presenting the graph to the user
Example 1.2. DatabaseDemo's major steps
public void start() {
  // Load the database driver into memory.
  loadDBDriver();

  // Create the graph.
  populateGraph();

  // Perform a layout on the created graph.
  performLayout();

  // Display the graph viewer with the graph.
  sgv.show();
}
In the sections to come, we will focus on how the graph structure is actually created (method populateGraph), and will then also briefly discuss the automatic layout of the created graph (method performLayout).
The actual database-related part, especially the database driver that is used, is ultimately just a means to an end to get the initial data to create the graph from. Consequently, we will just skip any database-related code, which, for example, also includes the loadDBDriver method. Nevertheless, in the DatabaseDemo source code you will find enough support (as comments) for "real" database connectivity that you can use and that will help you in re-using the demo in your environment.
Note
In order to use the demo code with other database drivers, you will need the corresponding drivers in your classpath.
The first part when we want to create a graph structure is to actually create the nodes. In the DatabaseDemo application, we want to create nodes for a company's employees which are represented in the database as table entries.
Example 1.3, “Setup for the database query” shows the beginning of the central try block in which the database query is prepared and executed.
Example 1.3. Setup for the database query
Connection connection = null;
try {
  // Create a connection to the database.
  connection = createDBConnection();

  // Create a Statement object to execute the query with.
  Statement stmt = connection.createStatement();

  // The actual query.
  ResultSet results = stmt.executeQuery(
    "SELECT id, firstname, lastname, gender, jobtitle, department, room,
            phoneextension, supervisor
     FROM employees_1");
  );

  ...
The results variable holds the result set of our query, which we will process and create one node for each employee entry. Basically, this processing/creating step boils down to a while loop that would look as illustrated in Example 1.4, “The basic scheme to creating nodes”.
Example 1.4. The basic scheme to creating nodes
while (results.next()) {
  Node employee = graph.createNode();
}
The actual source code in the DatabaseDemo both before and in the while loop looks different than what is shown above. Essentially, in the actual source code there are already preparations made for the second part, the creation of the edges, which we will analyze in the next section.
Note that the createNode()![]() method
we are using does not specify anything about either the geometry (location, width/height)
of a node nor the visual representation that should be used.
As we have learned earlier, in the Creating a Simple Graph Viewer
trail, a default representation and a default geometry is then used for each created
node.
These defaults are maintained by Graph2D, and in the graph viewer which we are using
from DatabaseDemo we have customized them to our application's needs.
method
we are using does not specify anything about either the geometry (location, width/height)
of a node nor the visual representation that should be used.
As we have learned earlier, in the Creating a Simple Graph Viewer
trail, a default representation and a default geometry is then used for each created
node.
These defaults are maintained by Graph2D, and in the graph viewer which we are using
from DatabaseDemo we have customized them to our application's needs.
The second part when we want to create a graph structure is to create edges that connect the nodes. In the DatabaseDemo application, we want to create edges between employees to show the supervisor relationship. In our database data this relationship is represented by values in the supervisor column, which for each employee that has a supervisor holds the employee ID of that supervisor's entry.
This indirection scheme (which is rather typical for a database) and also the fact that we cannot "just create" an edge, but always need the proper nodes that we actually want to connect, make some additional mapping data structures necessary.
We will add two mapping data structures to our code:
- a HashMap (id2Node) that will enable us to find the Node object that has been created for an employee given the employee's ID
- a yFiles NodeMap (node2SupervisorID) that will enable us to get the supervisor's employee ID ("supervisor ID" for short) given the Node object for an employee
Both are created before the while loop and then used therein.
The NodeMap specifically is created using the createNodeMap()![]() method of Graph2D (inherited from y.base.Graph), which returns a default NodeMap
implementation.
method of Graph2D (inherited from y.base.Graph), which returns a default NodeMap
implementation.
Important
Node maps (and also edge maps) are an important means to associate data with nodes (and edges) that is used throughout the yFiles for Java diagramming library.
Example 1.5. Entire while loop with preparations
// A map that binds the supervisor ID of each employee to the Node object.
NodeMap node2SupervisorID = graph.createNodeMap();

// This will map an employee ID to the according Node object.
HashMap id2Node = new HashMap();

while (results.next()) {
  Node employee = graph.createNode();

  // Add a mapping from an ID to a Node object.
  Integer id = new Integer(results.getInt("id"));
  id2Node.put(id, employee);

  // If a supervisor ID is set, bind it to the created Node object via the
  // NodeMap.
  String supervisorString = results.getString("supervisor").trim();
  if (supervisorString.length() > 0) {
    Integer supervisorID = Integer.valueOf(supervisorString);
    node2SupervisorID.set(employee, supervisorID);
  }
}
In the loop, the HashMap is filled right after a Node object has been created using the code shown in Example 1.6, “Filling the HashMap”.
Example 1.6. Filling the HashMap
// Add a mapping from an ID to a Node object.
Integer id = new Integer(results.getInt("id"));
id2Node.put(id, employee);
The NodeMap is filled with supervisor IDs only when they are non-empty as shown in Example 1.7, “Filling the NodeMap”.
Example 1.7. Filling the NodeMap
// If a supervisor ID is set, bind it to the created Node object via the
// NodeMap.
String supervisorString = results.getString("supervisor").trim();
if (supervisorString.length() > 0) {
  Integer supervisorID = Integer.valueOf(supervisorString);
  node2SupervisorID.set(employee, supervisorID);
}
Why do we need the NodeMap (more precisely, the mapping that it provides) at all? The actual reason for the NodeMap is that we are iterating over the query's result set once, processing a single entry at a time, and it can always be the case that the employee entry which is referred to by the supervisor ID value has not been seen yet. If the data would not contain such a "forward reference," we could easily do without the NodeMap and instead create an edge inside the while loop.
Instead, since we cannot assume a specific order in our data, the edges are created after the while loop. To this end, we will iterate over all nodes that we have created, and use the mappings established by the NodeMap and HashMap to create edges that connect employees with their corresponding supervisor.
Example 1.8, “Creating edges” shows the for loop for iterating over the nodes. It uses the NodeCursor idiom which allows convenient iteration over a set of nodes.
Example 1.8. Creating edges
// Now we walk through all nodes and create edges from the supervisor node to
// the employee node.
for (NodeCursor nc = graph.nodes(); nc.ok(); nc.next()) {
  Node node = nc.node();
  // Get the supervisor ID of this node using the NodeMap we filled when
  // creating the nodes.
  Integer supervisorID = (Integer) node2SupervisorID.get(node);
  if (supervisorID != null) {
    // If a supervisor ID is set, create an edge.
    graph.createEdge((Node) id2Node.get(supervisorID), node);
  }
}
Important
NodeCursor, and also EdgeCursor, are YCursor subtypes that provide iteration services. These types are supported and used throughout the yFiles for Java diagramming library. Using them in a for loop, for example, has the following typical structure:
for (NodeCursor nc = graph.nodes(); nc.ok(); nc.next()) {
  Node node = nc.node();

  // Do something with 'node'.
}
The cursor types are strongly related to the yFiles for Java list types NodeList and EdgeList, which themselves are subtypes of the general YList.
After we are done with graph creation, we no longer need the yFiles default node
map that we have created earlier, so we should dispose of the NodeMap.
We will do so using the disposeNodeMap![]() method of Graph2D (inherited from y.base.Graph) as shown in Example 1.9, “Disposing of the node map”.
method of Graph2D (inherited from y.base.Graph) as shown in Example 1.9, “Disposing of the node map”.
Example 1.9. Disposing of the node map
// Dispose of the NodeMap that we have bound to the graph, otherwise it will
// exist as long as the graph does.
graph.disposeNodeMap(node2SupervisorID);
Important
Default node maps (as well as default edge maps) that are created using the createNodeMap
(createEdgeMap()![]() ) method need to
be properly disposed of in order to avoid memory leaks.
) method need to
be properly disposed of in order to avoid memory leaks.
Discussion
The general scheme of first creating the nodes and then, in a second step, iterating over the created nodes and creating the edges, is typical for creating a graph structure when the graph elements are created according to some data from a database or model, for example. Specific to this scheme is also the necessity for some kind of additional mapping between the two "worlds," namely the graph elements and the original data.
Note that we have created our nodes without assigning specific coordinates to them, i.e., currently, they will use default coordinates which means they will all lie at (0, 0) in world coordinate space. Consequently, this means that we would not see much of our graph at the moment. (Especially given the fact that the simple graph viewer that we are using does not provide any support for moving nodes...) However, for this to change we will apply an automatic layout to the graph as described in the section called “Automatic Layout”.
On a related note, instead of using the preset uniform default node size for creating our nodes, we could also determine a uniform node size using the actual widths of all node labels. Corresponding enhancements at the end of the while loop in method populateGraph would look as follows, for example.
Example 1.10. Determining the maximum width and height among all node labels
double maxWidth = 0.0, maxHeight = 0.0;
while (results.next()) {
  ...

  double w = graph.getRealizer(employee).getLabel(0).getWidth();
  if (w > maxWidth) {
    maxWidth = w;
  }
  double h = graph.getRealizer(employee).getLabel(0).getHeight();
  if (h > maxHeight) {
    maxHeight = h;
  }
}
Then, after the while loop, we would set the size of each node explicitly by iterating over all nodes.
Example 1.11. Explicitly setting a uniform node size
for (NodeCursor nc = graph.nodes(); nc.ok(); nc.next()) {
  graph.setSize(nc.node(), maxWidth + 20, maxHeight + 10);
}
To set individual node widths that encompass the node label's text, we could use a similar approach where the node's width is set at the end of the while loop (replacing the code for determining the maximum width/height inside the while and then setting the size thereafter).
Now that we have created the basic graph structure with nodes representing employees and edges representing the supervisor relationship, we also want to integrate the rest of our data. We will add names and titles of our employees as well as gender to the picture using the node's label and color-coding, respectively.
Example 1.12. Setting the label text for each node
// Set a label text. We use one single label.
graph.getRealizer(employee).setLabelText(
  results.getString("jobtitle") + "\n" +
  results.getString("firstname") + " " + results.getString("lastname"));
We set the label text via the node's realizer, which is consistent given that the
realizer is responsible for creating the actual visual representation of the graph
element.
(Another possibility would be to use the corresponding setLabelText![]() convenience method from Graph2D.)
convenience method from Graph2D.)
The node label presentation is good, however, we want the title of an employee to stand out a little.
Let's use the node label's HTML abilities to add some style to the presentation of the text. This is accomplished by starting the actual text with <html>.
Example 1.13. Setting the styled label text for each node
// Set a label text. In this case we use one single label and customize it
// using HTML.
graph.getRealizer(employee).setLabelText(
  "<html><div align='center'><b>" +
  results.getString("jobtitle") + "</b><br>" + " " +
  results.getString("firstname") + " " + results.getString("lastname") +
  "</div></html>");
The support for rendering HTML code is limited to "simple" HTML only, since it uses the Java support for HTML rendering.
We will show the gender of our employees by color-coding the nodes. This is also done via the node realizer.
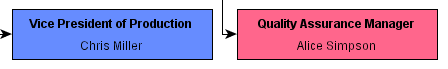
Example 1.14. Setting the color for each node
// Nodes of male employees are colored blue, nodes of female employees are
// colored rose.
if ("male".equals(results.getString("gender"))) {
  graph.getRealizer(employee).setFillColor(LIGHT_BLUE);
}
else {
  graph.getRealizer(employee).setFillColor(ROSE);
}
We still have some of the employee data left, namely the department, the employee's room number and the phone extension. Let's choose a tooltip to present these.
Conceptually, tooltip presentation in yFiles for Java is part of view mode functionality. We will use the TooltipMode class, which provides specialized tooltip support. In the DatabaseDemo constructor we add this view mode to the graph viewer's view. This enables the view mode to listen to mouse moved events in the canvas.
TooltipMode supports the tooltip text for each node to reside in a data provider. The view mode will query the graph if there is a data provider available under a specific key. And if there is, it will use the information provided therein whenever a node's tooltip should be presented.
The DataProvider![]() interface itself defines
read-only access to its data, so we cannot create a data provider and put in our
data.
Instead we create a node map, which defines read-write access, and let's us do this.
Before the while loop in the populateGraph method, we
create the nodeTooltips node map.
interface itself defines
read-only access to its data, so we cannot create a data provider and put in our
data.
Instead we create a node map, which defines read-write access, and let's us do this.
Before the while loop in the populateGraph method, we
create the nodeTooltips node map.
Example 1.16. Creating the node map to hold the tooltip text for the nodes
// A node map to hold the tooltip text.
NodeMap nodeTooltips = graph.createNodeMap();
Inside the while loop, (e.g., at its end) we then set the tooltip text for each employee.
Example 1.17. Setting the tooltip text for a node
nodeTooltips.set(employee,
  "<html><b>" + results.getString("department") +
  "</b><br>Room: " + results.getString("room") +
  "<br>Extension: " + results.getInt("phoneextension") + "</html>");
Lastly, after the while loop, we register our node map as a data provider using the well-known key defined in class TooltipMode.
Example 1.18. Adding the tooltip text data provider to the graph
graph.addDataProvider(TooltipMode.NODE_TOOLTIP_DPKEY, nodeTooltips);
Since the node map (which is now used as a simple data provider) is needed during our application's life-time, we do not dispose of it.
Figure 1.6, “Data presentation using tooltip in DatabaseDemo” shows the CEO's tooltip.
We have created the graph structure without assigning specific coordinates to the nodes or specifying actual edge paths. We intentionally did so, because, actually, the automatic layout algorithms available with the yFiles for Java diagramming library are designed just for this task.
The general procedure for performing a layout is illustrated in the performLayout
method of the DatabaseDemo application.
Disregarding the call to prepareLayout (in comments) for the moment,
we first create a Layouter, then wrap it using the BufferedLayouter![]() class, and on that we invoke the doLayout
class, and on that we invoke the doLayout![]() method with our graph as the parameter.
When that call returns, we adjust the view such that it shows the entire graph centered,
and trigger an immediate repaint of all views that present our graph.
method with our graph as the parameter.
When that call returns, we adjust the view such that it shows the entire graph centered,
and trigger an immediate repaint of all views that present our graph.
Example 1.19. Performing the layout
/** Run the layout algorithm in buffered mode. */
private void performLayout() {
  // OPTIONAL. Prepares the graph for edge grouping.
//  prepareForLayout();
  new BufferedLayouter(createLayouter()).doLayout(graph);
  sgv.getView().fitContent();
  graph.updateViews();
}
Wrapping a given Layouter with a BufferedLayouter is recommended practice. The benefits of this scheme can be summarized as additional safety that prevents graph structure corruption/modification. For example, as a side-effect of layout algorithms graph structures can eventually change, most often due to structural operations that algorithms are performing, like inserting and removing nodes or edges during layout calculation. BufferedLayouter avoids any modification to the original graph structure by giving a copy thereof to the actual layout algorithm.
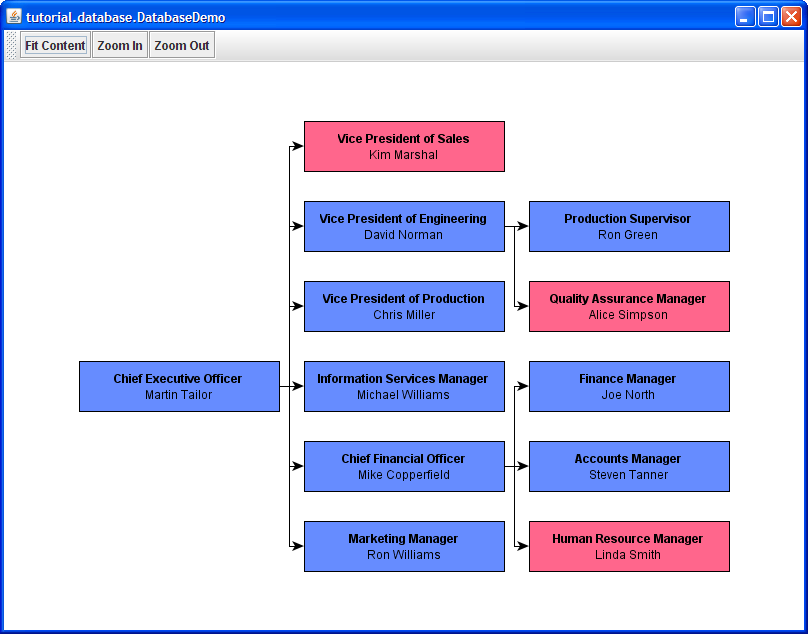
Example 1.20, “Setup of the layouter” shows the setup of the yFiles layout algorithm that we will use to actually arrange our organization chart. IncrementalHierarchicLayouter is not a specialized tree layout algorithm, but a more general-purpose hierarchical layout algorithm that is well-suited for tree structures also.
Example 1.20. Setup of the layouter
/** Creates a Layouter that will be used to perform a graph layout. */
private Layouter createLayouter() {
  IncrementalHierarchicLayouter ihl = new IncrementalHierarchicLayouter();

  // Optional layouter customizations.

  // Edges shall be routed in orthogonal fashion.
  ihl.getEdgeLayoutDescriptor().setOrthogonallyRouted(true);

  // Layout graph from left to right.
  ihl.setLayoutOrientation(LayoutOrientation.LEFT_TO_RIGHT);
  return ihl;
}
In the createLayouter method where we create the layouter, we also specify some settings. The first of which being that the layouter will create orthogonal edge paths, i.e., paths that consist of axes-parallel line segments. The second one being that the overall layout direction will be left to right, which means that our organization chart's root node will be at the leftmost position and the rest of the diagram will extend to the right.
Important
These options stem from different classes.
The first one is specific to the IncrementalHierarchicLayouter class, while the
second one is provided by its superclass CanonicMultiStageLayouter![]() .
Since CanonicMultiStageLayouter is the superclass for all major yFiles layout algorithms,
this option is also available even when a given layout algorithm has no understanding
of a layout direction at all (which is the case for organic layout, circular layout,
or orthogonal layout, for example)!
.
Since CanonicMultiStageLayouter is the superclass for all major yFiles layout algorithms,
this option is also available even when a given layout algorithm has no understanding
of a layout direction at all (which is the case for organic layout, circular layout,
or orthogonal layout, for example)!
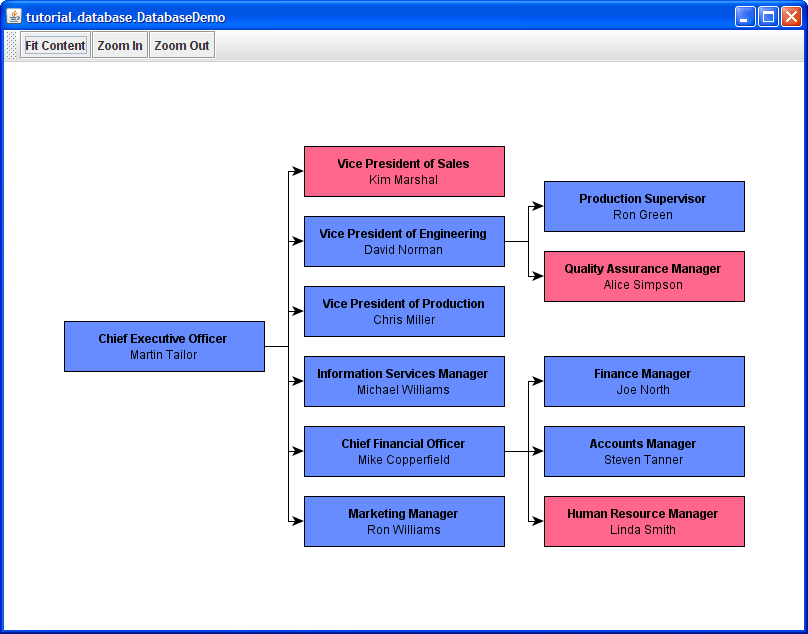
Now let's try another layout algorithm, a real tree layout algorithm this time.
The alternative layouter setup using class TreeLayouter![]() instead of IncrementalHierarchicLayouter looks quite similar to our previous one.
instead of IncrementalHierarchicLayouter looks quite similar to our previous one.
Example 1.21. Alternative layouter setup
private Layouter createLayouter() {
  TreeLayouter tl = new TreeLayouter();

  // Optional layouter customizations.

  // Edges shall be routed in orthogonal fashion.
  tl.setLayoutStyle(TreeLayouter.ORTHOGONAL_STYLE);

  // Layout graph from left to right.
  tl.setLayoutOrientation(LayoutOrientation.LEFT_TO_RIGHT);
  return tl;
}
The resulting presentation of our organization chart also looks quite similar, except the edges. They are routed in a bus-like fashion, i.e., the actual edge paths of edges connecting to a common source node are merged.
Related Resources
You will find related information in the yFiles for Java Developer's Guide:
In the yFiles for Java source code demos:
- Tree layout-related source code demo applications
- Hierarchical layout-related source code demo applications
Optional Setup
We can achieve the merged edge paths that are generated when using TreeLayouter in a similar manner also with IncrementalHierarchicLayouter. To this end, the optional prepareForLayout method adds logic that is used to prepare bus-style edge routing in conjunction with IncrementalHierarchicLayouter.
Example 1.22. Optional preparations for the layout
/** Establish the necessary setup for bus-style edge routing. */
private void prepareForLayout() {
  graph.addDataProvider(PortConstraintKeys.SOURCE_GROUPID_KEY,
                        new DataProviderAdapter() {
    public Object get(Object edge) {
      return ((Edge)edge).source();
    }
  });
}
With the addDataProvider![]() method of Graph2D (inherited from y.base.Graph), we associate additional information
with the graph.
We add a data provider using a "well-known" data provider key, namely PortConstraintKeys.SOURCE_GROUPID_KEY
method of Graph2D (inherited from y.base.Graph), we associate additional information
with the graph.
We add a data provider using a "well-known" data provider key, namely PortConstraintKeys.SOURCE_GROUPID_KEY![]() ,
which is used in conjunction with generating edge groupings (aka bus-style edge
routing).
During layout calculation, IncrementalHierarchicLayouter will query the graph if
there is a data provider available under that key.
And if there is, it will use the information provided therein.
,
which is used in conjunction with generating edge groupings (aka bus-style edge
routing).
During layout calculation, IncrementalHierarchicLayouter will query the graph if
there is a data provider available under that key.
And if there is, it will use the information provided therein.
For PortConstraintKeys.SOURCE_GROUPID_KEY specifically, the expected information is an object in return for a given edge of the graph. The edge paths of edges for which the same object is returned are then merged into one path at their source side (hence SOURCE_GROUPID_KEY; there is also a TARGET_GROUPID_KEY that is used for the target side of edges).
We use the DataProviderAdapter![]() interface
to specify the aditional information, which allows us to use logic instead of static
data.
In our implementation, for a given edge, we simply return the node at the source
side of the edge.
As a consequence, all edges that connect to the same source node will have the same
return value (their common source node), and thus their edge paths will be merged.
interface
to specify the aditional information, which allows us to use logic instead of static
data.
In our implementation, for a given edge, we simply return the node at the source
side of the edge.
As a consequence, all edges that connect to the same source node will have the same
return value (their common source node), and thus their edge paths will be merged.
This setup scheme for bus-style edge routing using data providers and the data provider keys defined in PortConstraintKeys is supported across all hierarchical layout algorithms.