| Chapter 6. Displaying and Editing Graphs | ||
|---|---|---|
| Prev | Next | |
Table of Contents
This chapter shows how to render a graph in a so-called "view." It presents the classes that are responsible for the visual representation of graph elements and explains their contribution to the "look and feel" of an application. Furthermore, it shows how user interaction with both graph elements and the view containing a graph is handled.
Package y.view![]() bundles the yFiles classes that provide user interface (UI) functionality.
UI functionality comprises two main aspects, namely the representation of a
graph structure to the user and the interaction of a user with the graph
structure.
bundles the yFiles classes that provide user interface (UI) functionality.
UI functionality comprises two main aspects, namely the representation of a
graph structure to the user and the interaction of a user with the graph
structure.
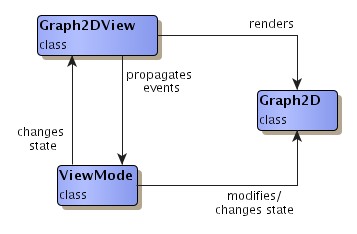
The classes from package y.view reflect the Model-View-Controller (MVC) paradigm, i.e., conceptually they can be divided into three types, each having specific responsibilities:
In terms of MVC then, class Graph2D![]() together with classes NodeRealizer
together with classes NodeRealizer![]() and
EdgeRealizer
and
EdgeRealizer![]() make up the model which
holds the data and its state.
Class Graph2DView
make up the model which
holds the data and its state.
Class Graph2DView![]() defines the view which
presents the information to the user.
Finally, class ViewMode
defines the view which
presents the information to the user.
Finally, class ViewMode![]() and its
descendants tie together model and view.
and its
descendants tie together model and view.
The respective parts of MVC are further described in the following sections:
Figure 6.1, “Model-View-Controller paradigm in package y.view” depicts the interdependencies of the three parts. The view (a Graph2DView instance) renders the model (an object of type Graph2D); it also propagates user interface events to the controller (class ViewMode and its descendants). According to these events, the controller then changes state on either view or model.
|
Copyright ©2004-2012, yWorks GmbH. All rights reserved. |