| About yFiles | ||
|---|---|---|
| Prev | Chapter 1. Preface | Next |
yFiles is a Java class library that provides algorithms and components for analyzing, viewing, and drawing graphs, diagrams, and networks. Its intended use is for application developers that are working on projects dealing with graph-related structures.
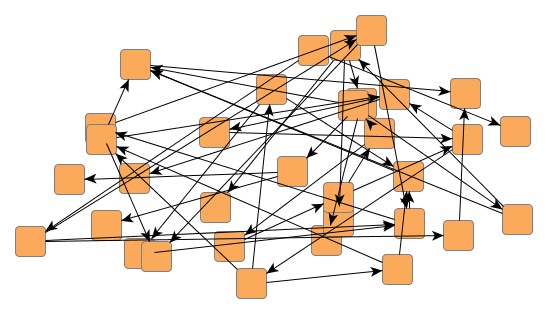
One of the main aspects of yFiles is the provision of sophisticated layout algorithms to support automatic generation of high-quality graph drawings. Take, for instance, the graph depicted in Figure 1.2, “Initial setup of some data”. It shows a "raw" version of a graph where it seems that the nodes have been placed randomly on the plane. Suppose this "raw" graph represents an initial setup of some data.
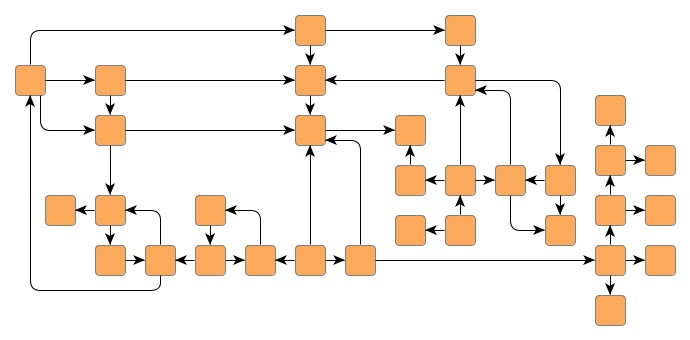
By using one of yFiles's layout algorithms the "raw" graph will be transformed into the arrangement shown in Figure 1.3, “Automatically computed "polished" drawing”. Note that the actual process of computing the "polished" drawing is completely automatic.
In a real-world scenario the initial setup could be even worse. For instance, when a graph is created from data retrieved from a database, any node created to represent an entity from a column would not have any positional information associated. Hence, the created nodes would all lie at the origin of the Cartesian coordinate system, i.e., they would "pile up."
Even for mathematically inclined people the term graph drawing can be misleading as to what it exactly should mean. Also, the term visualization is another popular occasion for a misunderstanding of the purposes the yFiles library serves.
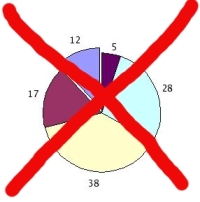
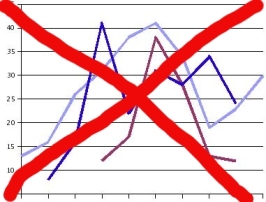
Figure 1.4, “Other forms of diagrams” shows some examples of other forms of graphs, or more generally diagrams, that yFiles does not support. In particular, the yFiles graph visualization library does not provide any functionality to draw pie charts, function plots, or anything the like.
|
Copyright ©2004-2012, yWorks GmbH. All rights reserved. |