| Working with Graph Hierarchies | ||
|---|---|---|
| Prev | Chapter 7. Graph Hierarchies | Next |
This page is from the outdated yFiles for Java 2.13 documentation. You can find the most up-to-date documentation for all yFiles products on the yFiles documentation overview page.
Please see the following links for more information about the yFiles product family of diagramming programming libraries and corresponding yFiles products for modern web apps, for cross-platform Java(FX) applications, and for applications for the Microsoft .NET environment.
The possibilities that are offered by a grouped graph can conveniently be used to improve a user's perception of a graph structure. For example, large data sets can be presented in a concise manner, and inherently hierarchically structured data can be modeled naturally.
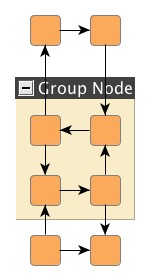
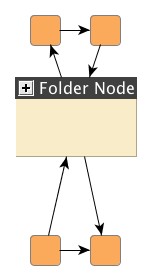
Grouping is a means to visually cluster a graph structure and have nodes that somehow belong together be combined within a group node. Nesting, in contrast, performs a real clustering in the sense that a folder node's inner graph no longer bloats the original graph structure, but is stored as a separate graph.
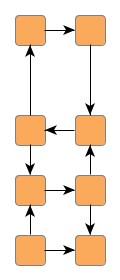
Figure 7.2, “Differences between grouping and nesting” presents the two concepts applied to the same sample graph side by side. The apparent differences between grouped nodes and nested nodes can easily be recognized at first sight.
Moreover, inter-edge behavior is also demonstrated. While all edges connect to their original end nodes with grouped nodes, the same edges are remodeled as inter-edges with nested nodes. The inter-edges connect to the folder node that contains the inner graph where their end nodes (the "real" nodes) reside in.
By nesting subgraphs within folder nodes a graph can easily be decomposed into a reduced version of itself and a number of inner graphs that are nicely organized. This characteristic is a perfect means to take the complexity out of a graph and present a more cleaned-up view to the user. At the same time, computation time of many algorithms is also reduced, since they actually handle less data.
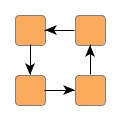
Figure 7.3, “Folder node and its inner graph” shows to the right the inner graph that, conceptually, is nested within the folder node to the left.
|
Copyright ©2004-2016, yWorks GmbH. All rights reserved. |