Visualization of Graph Elements
The overall look of the graph is determined by two factors: First, the location of the graph elements, which we call the layout of the graph.
The location of the graph elements can be specified programmatically by the developer, interactively by the user, or automatically by one of yFiles for HTML’s many advanced layout algorithms.
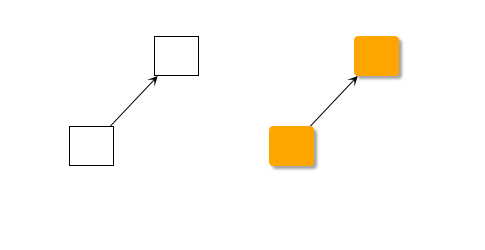
Second, the individual look of the elements themselves. The visual appearance for the graph elements is created by so-called styles in yFiles for HTML, which are responsible for the rendering of the elements at the specified location.
Styles
Before the GraphComponent can display an object on the canvas, it needs to know what it should look like. In the case of graph items, styles are the managing entities for creating the visual appearance as well as for updating them when the model has changed. Each type of graph element (except for bends) has an appropriate style interface. For example, the style interface for nodes is INodeStyle.
Even though the style is a property of the model item itself, the model is independent from the visualization. For example, the same graph model can be visualized using completely different styles without affecting the model at all.
As with all model item properties, the graph that the items reside in is responsible for managing those items. This means that the properties on the items are read-only and can only be set via the graph instance.
In the process of the visualization, the style receives the item that the visual appearance is to be created for, the bounds within which the visualization should be painted, and some more contextual information. It does not hold any information about the item itself and thus instances of styles are generally meant to be shareable among various items.
The graph has default settings for styles that are applied when items are created for which no specific style was given. In the default configuration, this default style is a single instance that is shared among all items created in such a way.
Sharing styles has the advantage of a better memory usage, but also the trait that every change to a property of a shared style is immediately reflected in all items that share this style.
yFiles for HTML comes with a wide array of predefined styles for all styleable graph elements. You can use these styles out-of-the-box. Some of the most prominent ones for nodes are the ShapeNodeStyle for basic geometric shapes and the ShinyPlateNodeStyle for a more modern looking style.
Only graph elements have styles associated, other elements in the view (for example the selection markers or handles) are visualized using a different mechanism as described in the section Customizing Selection, Focus, and Highlight.
Bends do not have an associated style interface because they are visualized as part of the edge visualization.
Instead of overburdened interfaces, the common interfaces for the styles are very small and each style implementation has its own set of properties to configure the resulting visual (for example the colors).
Arrows
Arrows are visual decorations that can be placed at an edge’s ends. Normally, this decoration is some kind of arrowhead that is used to indicate the edge’s direction.
Arrows do not define the direction of an edge. They only indicate it.
As visual decorations they are used with IEdgeStyle implementations which supports arrows. In yFiles for HTML, these are PolylineEdgeStyle and ArcEdgeStyle.
The IArrow interface provides a number of predefined arrowhead renderings which can be directly used with the sourceArrow and targetArrow properties of these styles.
const edgeStyle = new PolylineEdgeStyle({
  sourceArrow: IArrow.CIRCLE,
  targetArrow: IArrow.DIAMOND,
  stroke: Stroke.BLUE,
  smoothingLength: 5
})
| Name | Visualization |
|---|---|
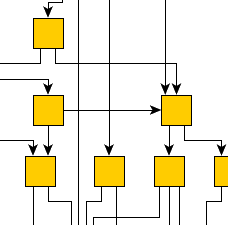
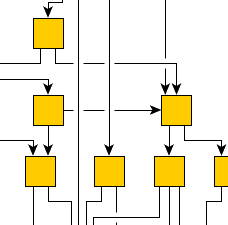
Bridges
When there are a lot of crossing edges, especially when they are orthogonal, it can be hard to determine where an edge actually leads. Bridges, or line jumps, are a means to resolve the visual ambiguity induced by intersecting edge paths. Each segment of an edge path that intersects with at least one other segment (from either the same or another edge path) can be augmented with a bridge in one of a variety of different styles like gap, arc, and rectangle.

Bridge rendering is handled by the BridgeManager class. It can be enabled on a GraphComponent’s graph by setting the GraphComponent to BridgeManager’s canvasComponent property:
const bridgeManager = new BridgeManager()
bridgeManager.canvasComponent = graphComponent
bridgeManager.addObstacleProvider(new GraphObstacleProvider())
To determine “obstacles” to render a bridge around the BridgeManager instance uses an implementation of the IObstacleProvider interface. The interface’s single method is used to get a GeneralPath that defines an actual obstacle.
The GraphObstacleProvider class, which is used in the above example code, is a convenience implementation that by default incorporates the obstacle definitions returned by all edges from the current graph in the BridgeManager’s GraphComponent.
By default, you can find an appropriate IObstacleProvider implementation in the lookup of each edge that uses a style with a PathBasedEdgeStyleRenderer<TStyle>-based style renderer. In yFiles for HTML these are styles PolylineEdgeStyle and ArcEdgeStyle.